Best Data Center REITs 2027: What Each One Owns
Best data center REITs 2027 compared by 10-K Schedule III: what Equinix, Digital Realty, Iron Mountain and American Tower own and what covers dividends.
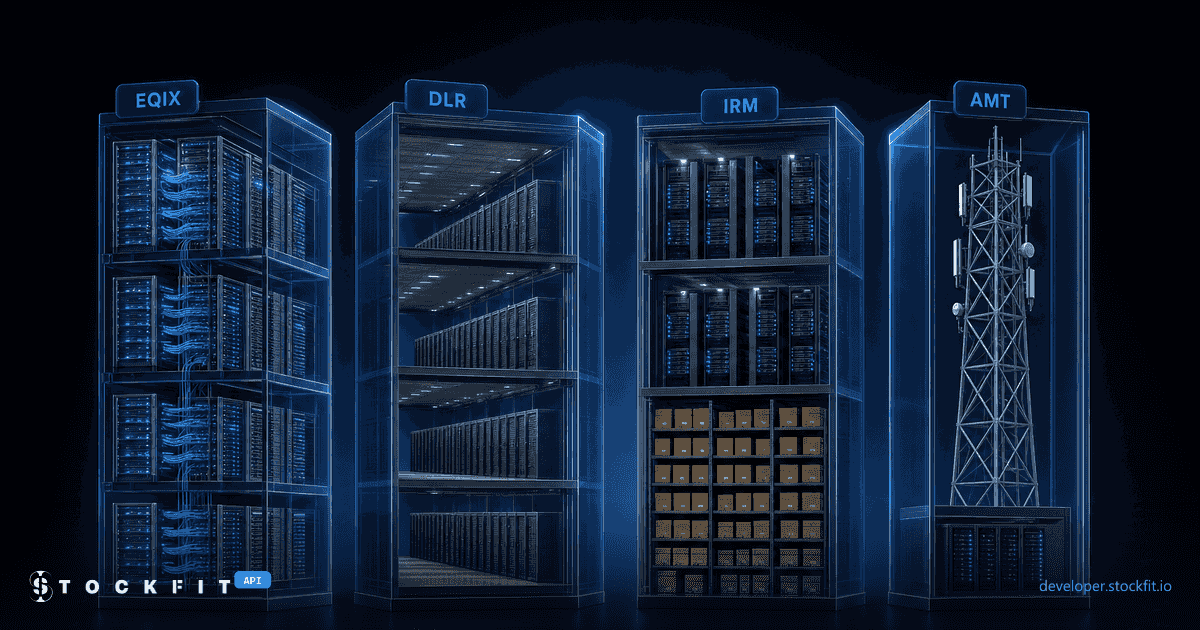
Search for the best data center REITs and the same four names come back in almost every list: Equinix, Digital Realty, Iron Mountain and American Tower. The lists rank them by dividend yield, analyst price targets and AI demand. None of them opens the one table in the 10-K that says what each company actually owns: Schedule III, Real Estate and Accumulated Depreciation.
We read all four FY2025 schedules. Two of the four are data center landlords through and through. The other two are mostly something else. Data centers are 25.7% of American Tower's Schedule III real estate, and Iron Mountain's four largest properties, all data center campuses, are 49.2% of its schedule while data centers earn 11.6% of its revenue. Every figure below comes from a 10-K filed with the SEC, with the accession number to check it. This is data, not investment advice.
The best data center REITs, compared by what they own
Gross carrying value in Schedule III is what a REIT paid for its land and buildings plus everything it has spent improving them since. It is a historical cost, not a market value, but it is audited, comparable across companies and it shows where the money went. Here are the four REITs side by side:
- EQIX Equinix$33.8 billion
Data center pure play. Data centers: 100%. 33.1% depreciated. FY2025 revenue $9.2 billion. Dividend coverage 2.11x.
- DLR Digital Realty$31.4 billion
Data center pure play. Data centers: 100%. 31.9% depreciated. FY2025 revenue $6.1 billion. Dividend coverage 1.40x.
- IRM Iron Mountain$7.9 billion
Records storage plus data centers. Data centers: 49.2% in four campuses. 21.1% depreciated. FY2025 revenue $6.9 billion. Dividend coverage 1.46x.
- AMT American Tower$29.8 billion
Cell towers plus data centers. Data centers: 25.7%. 35.7% depreciated. FY2025 revenue $10.6 billion. Dividend coverage 1.72x.
| REIT | What it is | Schedule III gross | Data centers | Depreciated | FY2025 revenue | OCF / dividends |
|---|---|---|---|---|---|---|
| EQIX | Data center pure play | $33.8 billion | 100% | 33.1% | $9.2 billion | 2.11x |
| DLR | Data center pure play | $31.4 billion | 100% | 31.9% | $6.1 billion | 1.40x |
| IRM | Records storage plus data centers | $7.9 billion | 49.2% in four campuses | 21.1% | $6.9 billion | 1.46x |
| AMT | Cell towers plus data centers | $29.8 billion | 25.7% | 35.7% | $10.6 billion | 1.72x |
Schedule III as of December 31, 2025, from each FY2025 10-K. Depreciated: accumulated depreciation over gross carrying value. OCF / dividends: operating cash flow over cash dividends paid, both from the FY2025 cash flow statement.
Equinix and Digital Realty are the two pure plays: every row in their schedules is data center property, $33.8 billion and $31.4 billion. American Tower owns almost as much real estate as either, $29.8 billion, but 74.3% of it is communication sites. Iron Mountain is the smallest by real estate and the most interesting to read: a records storage company whose newest and largest buildings are data centers.
So "best" depends on what you want to own. For data center real estate and nothing else, the schedules leave two names. For a company in transition, Iron Mountain shows it in its own numbers. For towers with a data center business on the side, that is American Tower. The rest of this post shows how each of those readings comes out of the filings.
What counts as a data center REIT
A data center REIT owns the buildings that house servers, along with the power, cooling and network connections they need, and leases that capacity to tenants. The business comes in three broad shapes:
- Colocation: many customers rent cages, racks or suites inside a shared facility and pay for space and power.
- Interconnection: customers in the same building pay for cross-connects, direct cables between their networks, clouds and service providers. The more networks in one building, the more each connection is worth.
- Hyperscale: a single cloud provider leases a whole hall or building, usually on long-term contracts sized in megawatts.
As a real estate investment trust, each company has to distribute at least 90% of its taxable income to shareholders, which is why dividends sit at the center of every REIT discussion. And as a real estate company filing with the SEC, each one has to file Schedule III with its 10-K: one row per property or group of properties, with initial cost, costs capitalized since, gross carrying value and accumulated depreciation.
The schedule is required, but its shape is not standard. Equinix files 52 rows by country and metro. Digital Realty files by metro, from Northern Virginia to Durban. Iron Mountain lists 166 properties by street address. American Tower files two lines, communication sites and data centers. Any comparison has to read each schedule on its own terms, which is what we did. For how one schedule looks as structured data, row by row, see our walkthrough of the REIT property schedule API, served by /api/footnotes/reit-properties.
Equinix vs Digital Realty: similar real estate, different business
On paper, the two largest data center REITs own about the same amount of real estate: $33.8 billion for EQIX and $31.4 billion for DLR, both about a third depreciated (33.1% and 31.9%). Their revenue is not close. Equinix booked $9.2 billion in FY2025, Digital Realty $6.1 billion.
The difference is the business model, and it lines up with the rival comparisons on page one of the search results. Equinix is built around interconnection and retail colocation, many customers per building paying for space, power and cross-connects. Digital Realty is known for larger leases to hyperscale and enterprise tenants, alongside its own colocation and interconnection business. One caveat applies to both: Schedule III covers real estate on the balance sheet, so a revenue figure divided by it is not a clean yield on property. Equinix's column for capitalized costs reads "Costs Capitalized Subsequent to Acquisition or Lease", so leased sites show up only through what was spent on them.
Geography is the clearer split. Equinix spreads its real estate across three regions: 44.4% Americas, 35.0% EMEA and 20.6% Asia-Pacific. Digital Realty is almost entirely North America and EMEA, 47.3% and 47.8%, with 4.9% in Asia-Pacific.
The largest rows in each schedule
Equinix's largest named rows are Germany ($2.40 billion), Washington, D.C. ($2.28 billion), New York ($2.28 billion), London ($2.09 billion), followed by Singapore and Australia. Digital Realty's single largest metro is Northern Virginia at $4.13 billion, 13.2% of its schedule, followed by Frankfurt ($2.50 billion), Paris ($2.14 billion), London ($1.97 billion). Both 10-Ks are on EDGAR for anyone who wants to read the schedules line by line: Equinix FY2025 10-K and Digital Realty FY2025 10-K.
How much of Iron Mountain is data centers
IRM built its name storing paper records, and its Schedule III still reads like it: 166 rows of warehouses and records centers from Boyers, Pennsylvania to Lima and Singapore. Its business segments, from /api/footnotes/business-segmentation, give three different answers to how much of it is data centers, depending on what you measure:
- Revenue: the Global Data Center Business earned $803 million in FY2025, 11.6% of $6.90 billion. Records and information management earned $5.29 billion.
- Segment assets: the data center segment holds $7.97 billion, 37.7% of the three segments' assets.
- Schedule III: the four largest rows are all data center campuses, and together they are $3.90 billion, 49.2% of the $7.92 billion schedule.
| Address | Campus | Gross | Depreciated |
|---|---|---|---|
| 11660 Hayden Road, Manassas, Virginia | VA-2 | $2,309 million | 5.7% |
| 615 North 48th Street, Phoenix, Arizona | AZP-1 | $559 million | 22.2% |
| 4802 East Van Buren, Phoenix, Arizona | AZP-2 | $548 million | 9.5% |
| 3003 Woodbridge Avenue, Edison, New Jersey | NJE-1 | $481 million | 20.1% |
The four largest of 166 rows in Iron Mountain's FY2025 Schedule III, matched to the data center campus at each address.
The Manassas row alone, the VA-2 campus in Northern Virginia, is $2,309 million, or 29.1% of everything Iron Mountain lists in Schedule III. The age of the money tells the same story. The four campuses are 10.4% depreciated. The other 162 rows are 31.5% depreciated. The data centers are where the new capital went.
Revenue is catching up. The data center segment grew from $495 million in FY2023 to $620 million in FY2024 and $803 million in FY2025, up 25.3% and then 29.6%. For how segment tables like this one are tagged and how to read operating income per segment, see operating income by segment.
How much of American Tower is data centers
AMT became a data center owner on December 28, 2021, when it closed its acquisition of CoreSite at an enterprise value of about $10.1 billion. Four years later, its Schedule III splits its real estate into two lines: communication sites at $22.16 billion and data centers at $7.68 billion. Data centers are 25.7% of the real estate.
By revenue the share is smaller. The data centers segment reports $1,053 million of revenue in the FY2025 10-K, 9.9% of American Tower's $10.64 billion, with $402 million cost of revenue, a 61.8% segment gross margin. Like Iron Mountain, the data center property is the younger part of the book: 20.6% depreciated against 41.0% for the communication sites. American Tower is a tower REIT with a data center business attached, and its filing says so in two lines.
Data center REIT dividends: what covers them
Most rankings lead with dividend yield. The harder question is what pays the dividend, and the usual shortcut, the payout ratio on net income, breaks for REITs. Real estate depreciation is a large non-cash expense that pulls net income down, and property sales push it up. In FY2025, Iron Mountain paid $919 million in dividends against $152 million of net income, a payout of 604%. Digital Realty's $1,309 million of net income includes a $996 million gain on disposition, a one-time item that has nothing to do with recurring rent.
The industry answer is FFO, funds from operations: net income with real estate depreciation added back and property sale gains taken out. FFO is a non-GAAP measure that companies publish in their earnings releases with their own adjustments, so it is not one comparable number across filers. We stay with the audited cash flow statement instead: operating cash flow divided by cash dividends paid. A value above 1.0x means the year's operating cash covered the dividend.
In FY2025 the order was Equinix 2.11x, American Tower 1.72x, Iron Mountain 1.46x, Digital Realty 1.40x. Over six years, Equinix has had the widest cushion, peaking at 2.57x in 2022. Digital Realty has had the thinnest, down to 1.08x in 2023. Both figures come straight from /api/earnings/dividend-history, and the underlying cash flow lines are in /api/financials/cash-flow-statement with the accession number of the 10-K behind each fact. Coverage is not a forecast of future dividends. For more on payout ratio and coverage, see the dividend payout ratio API guide. Not financial advice.
Data center REITs vs data center ETFs
If the goal is exposure to the whole theme instead of one company, ETFs bundle these REITs with tower owners, chip makers and utilities. What each data center ETF actually holds, line by line, is in our comparison of the best data center ETFs. The same caution applies there as here: the label on a fund or a REIT says less than its filings do.
One newcomer is worth watching. Blackstone Digital Infrastructure Trust (BXDC) listed on the NYSE on May 14, 2026 after a $1.75 billion IPO, with a plan to buy newly built hyperscale data centers. It filed its first quarterly report as a public company on November 16, 2026. It has not filed a 10-K yet, so there is no Schedule III to compare. Its first annual report will show what the money bought.
Pull the comparison yourself
Every number in this post can be rebuilt from SEC filings, and most of it from a few API calls. The property schedule comes from /api/footnotes/reit-properties. One request returns a fiscal year of Schedule III rows:
curl "https://api.stockfit.io/v1/api/footnotes/reit-properties?symbol=IRM&period=annual" \
  -H "Authorization: Bearer $STOCKFIT_API_KEY"
Trimmed to Iron Mountain's two largest rows, the FY2025 response looks like this:
[
  {
    "period": "2025-12-31",
    "fiscalYear": 2025,
    "fiscalPeriod": "FY",
    "properties": [
      {
        "member": "irm:A11660HaydenRoadManassasVirginiaMember",
        "name": "A 11660 Hayden Road Manassas Virginia",
        "locationMember": "country:US",
        "locationName": "United States",
        "currency": "USD",
        "gross": 2308707000,
        "accumulatedDepreciation": 132323000
      },
      {
        "member": "irm:A615North48thStreetPhoenixArizonaMember",
        "name": "A 615 North 48th Street Phoenix Arizona",
        "locationMember": "country:US",
        "locationName": "United States",
        "currency": "USD",
        "gross": 558908000,
        "accumulatedDepreciation": 124324000
      }
    ],
    "dateFiled": "2026-02-12"
  }
]
gross is the gross carrying value and accumulatedDepreciation the depreciation to date, both in US dollars. Some filers also tag portfolio totals as rows, so check the sum against the filing's total before relying on it. For Iron Mountain, the 166 rows add up to the 10-K total to the dollar. This script computes the depreciated share and the largest properties, then pulls dividend coverage:
import os
import requests

BASE = "https://api.stockfit.io/v1/api"
HEADERS = {"Authorization": f"Bearer {os.environ['STOCKFIT_API_KEY']}"}

def get(path, **params):
    response = requests.get(f"{BASE}{path}", headers=HEADERS, params=params, timeout=30)
    response.raise_for_status()
    return response.json()

# Schedule III: what the REIT owns, property by property
schedule = get("/footnotes/reit-properties", symbol="IRM", period="annual")[0]
rows = sorted(schedule["properties"], key=lambda p: p["gross"], reverse=True)
gross = sum(p["gross"] for p in rows)
depreciation = sum(p["accumulatedDepreciation"] for p in rows)
print(f"{len(rows)} rows, gross {gross / 1e9:.2f}B, {depreciation / gross:.1%} depreciated")
for p in rows[:4]:
    print(f"{p['name']}: {p['gross'] / 1e6:,.0f}M, {p['gross'] / gross:.1%} of the schedule")

# Dividend coverage: operating cash flow / dividends paid, per fiscal year
for year in get("/earnings/dividend-history", symbol="IRM", period="annual", limit=6):
print(year["fiscalYear"], year["dividendCoverage"])166 rows, gross 7.92B, 21.1% depreciated
A 11660 Hayden Road Manassas Virginia: 2,309M, 29.1% of the schedule
A 615 North 48th Street Phoenix Arizona: 559M, 7.1% of the schedule
A 4802 East Van Buren Phoenix Arizona: 548M, 6.9% of the schedule
A 3003 Woodbridge Avenue Edison New Jersey: 481M, 6.1% of the schedule
2025 1.4575
2024 1.5157
...Revenue, net income and operating cash flow for any of the four come from /api/financials/income-statement and the cash flow statement endpoint, each value with the accession number of the filing it came from. The statements and dividend history work on a ; the segment table is on the Starter, Stock and Pro plans and Schedule III on Pro. The same footnote data behind this post is what the Stock API serves for every US filer.
FAQ
Q.What are the best data center REITs in 2027?
Q.Is Iron Mountain a data center REIT?
Q.How much of American Tower is data centers?
Q.What is the difference between Equinix and Digital Realty?
Q.How are data center REIT dividends covered?
Q.What is Schedule III in a REIT 10-K?
Q.Is there an ETF for data center REITs?
Q.Is Blackstone Digital Infrastructure Trust a data center REIT?
Ready to build?
Free API key, no credit card.