Operating Income by Segment: Who Earns the Profit
Operating income by segment from 10-K filings: segment operating margin, reconciliation to consolidated totals, and recasts, via a segment data API.
Meta reported $83,276 million of operating income for 2025. That figure is the sum of a $102,469 million profit and a $19,193 million loss, the results of Meta's two reportable segments, Family of Apps and Reality Labs. Amazon's $79,975 million is mostly one business: AWS earned 57.0% of it on 18.0% of revenue. Neither split appears on the income statement. Both sit in the segment note of the 10-K, where companies report operating income by segment.
That note is easy to read for one company and surprisingly hard to collect for many. SEC's free XBRL API returns Amazon's consolidated figure and nothing for AWS. /api/footnotes/business-segmentation returns revenue, operating income, and six more metrics per reportable segment and fiscal period in one call. Below: what segment reporting discloses, why SEC's API can't return it, a real response for Amazon, segment operating margin across Amazon, Alphabet, Microsoft, and Meta, a short script that reconciles each segment table to the consolidated income statement, and the recasts that quietly rewrite segment history.
Operating income by segment: what the consolidated number hides
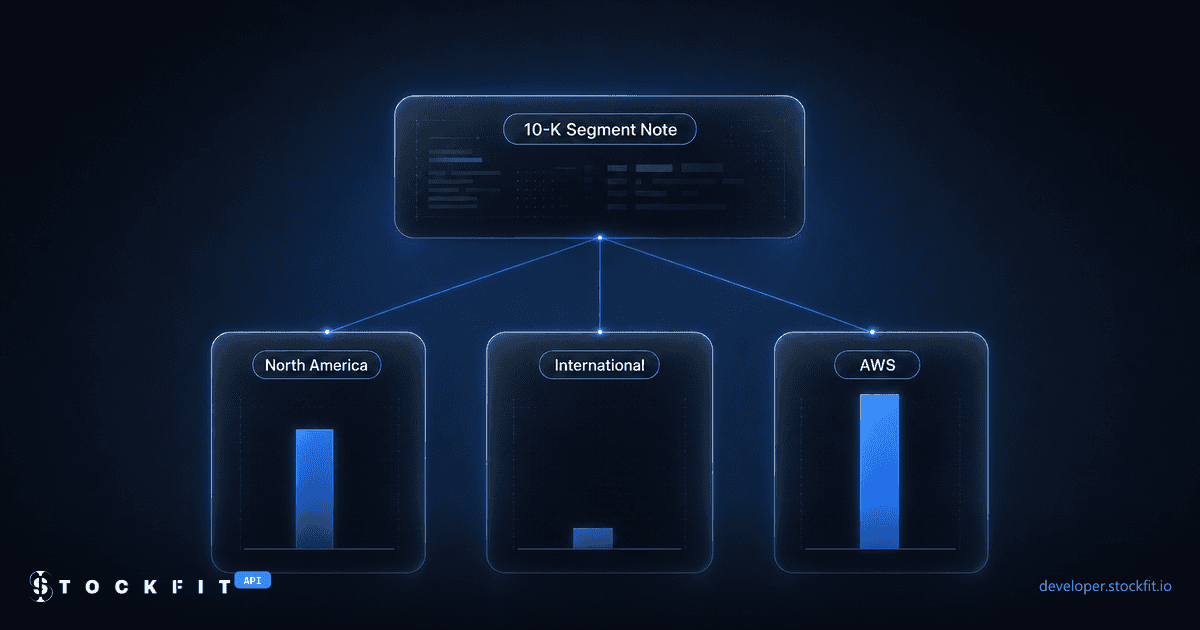
Amazon reports three segments: North America, International, and AWS. Put each one's share of revenue next to its share of operating income for fiscal 2025:
North America brought in 59.5% of revenue and 37.0% of operating income. International brought in 22.6% and 5.9%. AWS flipped the ratio: 18.0% of revenue, 57.0% of operating income. Amazon's consolidated operating margin of 11.2% averages a 35.4% business with a 6.9% one and a 2.9% one, and the average describes none of them.
The gap was wider in the latest quarter. In the three months ended June 30, 2026, AWS earned 60.5% of Amazon's $27,461 million operating income on 21.1% of its revenue (10-Q 0001018724-26-000026, filed July 31, 2026).
Profit is half of the segment story. The same note carries each segment's assets and property and equipment additions, and there AWS leads again: it accounted for $96.5 billion of the $140.0 billion the three segments added in 2025, 68.9%, and its segment assets of $252.6 billion at December 31, 2025 exceeded North America's $235.7 billion. A segment that earns most of the profit while absorbing most of the investment is a different business from one that earns it lightly, and only segment data tells you which one you are looking at.
What segment reporting discloses under ASC 280
Segment reporting is governed by ASC 280, and it follows the management approach: a company's operating segments are the components its chief operating decision maker (CODM), often the CEO, reviews to allocate resources and assess performance. An operating segment becomes a reportable segment when its revenue, its profit or loss, or its assets reach 10% of the combined total for all operating segments.
For each reportable segment, the note discloses:
- Revenue, split into sales to external customers and intersegment sales.
- A measure of segment profit or loss. It is whatever measure the CODM uses, so it is not a uniform GAAP line. Amazon, Microsoft, Meta, and Alphabet all report operating income; other companies report adjusted measures.
- Assets, depreciation and amortization, and additions to long-lived assets, when they are included in segment profit or regularly provided to the CODM.
- A reconciliation of segment totals to consolidated revenue, profit, and assets, which is where unallocated corporate costs and intersegment eliminations show up.
ASU 2023-07 expanded the note for fiscal years beginning after December 15, 2023: public companies now also disclose the significant segment expenses regularly provided to the CODM, an amount for other segment items, and the CODM's title, and a company with a single reportable segment provides the full set of segment disclosures. Interim periods followed in fiscal years beginning after December 15, 2024.
In the XBRL version of the filing, each segment value is a fact tagged with a member on the us-gaap:StatementBusinessSegmentsAxis dimension, such as amzn:AmazonWebServicesSegmentMember. Segments describe how management runs the business. Revenue split by product line or by country is a separate disclosure, covered in our post on the revenue segmentation API.
Why SEC's XBRL API returns no segment data
The obvious first stop is SEC's own XBRL API. Ask it for Amazon's OperatingIncomeLoss:
curl -A "your-app you@example.com" \
  "https://data.sec.gov/api/xbrl/companyconcept/CIK0001018724/us-gaap/OperatingIncomeLoss.json"
The fiscal 2025 entry, trimmed from the response:
{
  "start": "2025-01-01",
  "end": "2025-12-31",
  "val": 79975000000,
  "accn": "0001018724-26-000004",
  "fy": 2025,
  "fp": "FY",
  "form": "10-K",
  "filed": "2026-02-06",
  "frame": "CY2025"
}
That is the consolidated $79,975 million, and it is the only entry for that period. Across all 289 entries in the file, AWS's $45,606 million never appears. It is in the same 10-K, reported on a dimension. Here is the raw fact from the filing's XBRL instance:
<context id="c-141">
  <entity>
    <identifier scheme="http://www.sec.gov/CIK">0001018724</identifier>
    <segment>
      <xbrldi:explicitMember dimension="us-gaap:StatementBusinessSegmentsAxis">amzn:AmazonWebServicesSegmentMember</xbrldi:explicitMember>
    </segment>
  </entity>
  <period>
    <startDate>2025-01-01</startDate>
    <endDate>2025-12-31</endDate>
  </period>
</context>

<us-gaap:OperatingIncomeLoss contextRef="c-141" decimals="-6" id="f-1437" unitRef="usd">45606000000</us-gaap:OperatingIncomeLoss>
SEC's EDGAR API documentation says the XBRL APIs aggregate facts that use a standard taxonomy and "apply to the entire filing entity." A fact with a segment member applies to one segment, so companyconcept, companyfacts, and frames all leave it out. To build segment data yourself, you download each filing's instance, resolve every context to its dimension members, keep the facts on the segment axis, drop the subtotal members that would double-count, and repeat that for every company and year. It is the same dimensional trap behind Level 3 assets by company, where SEC's API returns a fair value total without the levels.
Operating income by segment in one API call
One request per company and period type. Here is Amazon, latest fiscal year:
curl "https://api.stockfit.io/v1/api/footnotes/business-segmentation?symbol=AMZN&period=annual&limit=1" \
-H "Authorization: Bearer $STOCKFIT_API_KEY"[
{
"period": "2025-12-31",
"fiscalYear": 2025,
"fiscalPeriod": "FY",
"unit": "USD",
"segments": [
{
"member": "amzn:NorthAmericaSegmentMember",
"name": "North America Segment",
"role": "segment",
"metrics": {
"revenue": 426305000000,
"operatingIncome": 29619000000,
"assets": 235652000000,
"goodwill": 19363000000,
"capex": 35919000000
}
},
{
"member": "amzn:InternationalSegmentMember",
"name": "International Segment",
"role": "segment",
"metrics": {
"revenue": 161894000000,
"operatingIncome": 4750000000,
"assets": 81984000000,
"goodwill": 2578000000,
"capex": 7617000000
}
},
{
"member": "amzn:AmazonWebServicesSegmentMember",
"name": "Amazon Web Services Segment",
"role": "segment",
"metrics": {
"revenue": 128725000000,
"operatingIncome": 45606000000,
"assets": 252588000000,
"goodwill": 1332000000,
"capex": 96496000000
}
}
],
"dateFiled": "2026-07-31"
}
]The three operating income values match Amazon's fiscal 2025 10-K (accession 0001018724-26-000004) to the dollar and sum to its consolidated $79,975 million. Each entry carries:
| Field | What it is |
|---|---|
| member | The raw XBRL member, for example amzn:AmazonWebServicesSegmentMember. Stable across years unless the filer renames it. |
| name | A display label derived from the member. |
| role | segment (an additive reportable segment), elimination (intersegment eliminations, usually negative), reconciling (a bridging item such as corporate costs), or subtotal (a rollup of other members, omitted unless you pass includeSubtotals=true). Sum segment, elimination, and reconciling rows. |
| metrics | revenue, operatingIncome, grossProfit, assets, goodwill, depreciationAmortization, capex, netIncome. A key is present only when the filer tagged that concept for the segment. capex is property and equipment additions (us-gaap:SegmentExpenditureAdditionToLongLivedAssets), not the cash flow statement purchases line. |
| dateFiled | Filing date of the newest filing that reported any value for the period. |
The dateFiled of 2026-07-31 is not the 10-K date. Amazon's second-quarter 10-Q repeats its December 31, 2025 segment assets, so the newest filing that reported a value for fiscal 2025 is the 10-Q filed July 31, 2026. The revenue and operating income come from the 10-K. The same newest-filing rule is what carries recasts, covered below.
The endpoint is on the Starter, Stock, and Professional plans (Starter is $19/mo, $15/mo billed annually). Starter returns up to five fiscal years per call; Stock and Professional return up to 40. Revenue by product and by geography comes from the sibling endpoint, /api/footnotes/revenue-segmentation. to start with the income statement, which is on every plan.
Segment operating margin: the spread inside one company
Segment operating margin is a segment's operating income divided by the same segment's revenue. Here it is for the latest fiscal year at four companies:
The spread inside each company is wider than the spread between them. Microsoft's Productivity and Business Processes segment ran a 59.9% operating margin in fiscal 2026, the year ended June 30, 2026, and More Personal Computing 26.6%; Microsoft as a whole, 46.8%. Alphabet's Google Services earned 40.7% in 2025 against 23.7% for Google Cloud. At Amazon, AWS's 35.4% sits next to 6.9% in North America and 2.9% in International.
Two segments are left off the chart because their losses are larger than their revenue. Alphabet's Other Bets lost $7,515 million on $1,537 million of revenue in 2025. Meta's Reality Labs is the extreme case.
Meta: a $19.2 billion segment loss inside a 41.4% margin
Family of Apps, which Meta's 10-K describes as Facebook, Instagram, Messenger, WhatsApp, and other services, grew its operating income from $42.7 billion in fiscal 2022 to $102.5 billion in 2025. Reality Labs, whose revenue comes from consumer hardware such as Meta Quest and AI glasses and related software and content, lost more in each of those years: $13.7 billion, $16.1 billion, $17.7 billion, $19.2 billion. That is $66.8 billion in four years, on $2,207 million of 2025 revenue. Family of Apps ran a 51.6% margin in 2025; Meta as a whole, 41.4%. Read only the consolidated line and you miss that one segment's profit absorbs the other's loss.
Reconciling segment operating income to the consolidated total
A segment table you cannot reconcile is a segment table you cannot trust. The check is cheap: sum the segment rows and compare them with consolidated operating income from /api/financials/income-statement, whose sources cite the accession number of the filing each value came from. In under 40 lines of JavaScript (Node 18 or later, saved as reconcile.mjs):
const BASE = 'https://api.stockfit.io/v1/api';
const headers = { Authorization: `Bearer ${process.env.STOCKFIT_API_KEY}` };

async function get(path) {
  const res = await fetch(`${BASE}${path}`, { headers });
  if (!res.ok) {
    throw new Error(`${res.status} for ${path}`);
  }
  return res.json();
}

const bn = usd => `${usd < 0 ? '-' : ''}$${(Math.abs(usd) / 1e9).toFixed(1)}B`;
const pct = x => `${(x * 100).toFixed(1)}%`;

for (const symbol of ['AMZN', 'MSFT', 'META', 'GOOGL']) {
  const [seg] = await get(`/footnotes/business-segmentation?symbol=${symbol}&period=annual&limit=1`);
  const [inc] = await get(`/financials/income-statement?symbol=${symbol}&period=annual&limit=1`);
  if (seg.fiscalYear !== inc.fiscalYear) {
    throw new Error(`${symbol}: segment FY${seg.fiscalYear} vs income statement FY${inc.fiscalYear}`);
  }

  console.log(`${symbol} FY${seg.fiscalYear}`);
  let segmentSum = 0;
  for (const s of seg.segments) {
    const { revenue, operatingIncome } = s.metrics;
    if (operatingIncome === undefined) {
      continue;
    }
    segmentSum += operatingIncome;
    const margin = revenue ? pct(operatingIncome / revenue) : 'n/a';
    console.log(`  ${s.name.padEnd(36)} ${bn(operatingIncome).padStart(8)}  margin ${margin.padStart(7)}`);
  }

  const consolidated = inc.facts.operatingIncome;
  const bridge = consolidated - segmentSum;
  const verdict = bridge === 0 ? 'ties exactly' : `bridge ${bn(bridge)} is outside the segment rows`;
  console.log(`  segments ${bn(segmentSum)} vs consolidated ${bn(consolidated)}: ${verdict}`);
}
Run against the live API, it prints:
AMZN FY2025
  North America Segment                  $29.6B  margin    6.9%
  International Segment                   $4.8B  margin    2.9%
  Amazon Web Services Segment            $45.6B  margin   35.4%
  segments $80.0B vs consolidated $80.0B: ties exactly
MSFT FY2026
  Productivity And Business Processes    $83.9B  margin   59.9%
  Intelligent Cloud                      $57.0B  margin   41.3%
  More Personal Computing                $14.4B  margin   26.6%
  segments $155.2B vs consolidated $155.2B: ties exactly
META FY2025
  Family Of Apps                        $102.5B  margin   51.6%
  Reality Labs                          -$19.2B  margin -869.6%
  segments $83.3B vs consolidated $83.3B: ties exactly
GOOGL FY2025
  Google Services                       $139.4B  margin   40.7%
  Google Cloud                           $13.9B  margin   23.7%
  All Other Segments                     -$7.5B  margin -488.9%
  segments $145.8B vs consolidated $129.0B: bridge -$16.8B is outside the segment rows
Amazon, Microsoft, and Meta tie to the dollar, because they allocate every operating cost to a segment. Alphabet does not, and the check says so. Its three segments sum to $145,799 million against $129,039 million consolidated, and the $16,760 million difference is a line in Alphabet's own table, Alphabet-level activities, which its 10-K says "primarily reflect expenses related to our shared AI research and development." Alphabet tags that line on srt:ConsolidationItemsAxis with us-gaap:CorporateNonSegmentMember and no segment member, so it is not a row on the segment axis. A sum that does not tie is information, not an error: it tells you how much cost sits above the segments.
One label to know: All Other Segments is the derived name of us-gaap:AllOtherSegmentsMember, which Alphabet labels Other Bets in its own filing.
Segment recasts: the same fiscal year, two different answers
Companies reorganize, and when they do, they restate prior years in the new structure. Consolidated totals stay put; segment figures move. Here is Microsoft's fiscal 2024, as first reported and as restated:
In its 10-K filed July 30, 2024, Microsoft reported fiscal 2024 Intelligent Cloud operating income of $49,584 million on $105,362 million of revenue, its largest segment by revenue. In August 2024 it changed its segments, in its own words "most notably bringing the commercial components of Microsoft 365 together in the Productivity and Business Processes segment," and recast prior years in an 8-K filed December 3, 2024. Restated, the same year's Intelligent Cloud earned $37,813 million on $87,464 million, and Productivity and Business Processes became the largest segment, with $106,820 million of revenue against $77,728 million as first reported. Consolidated operating income was $109,433 million in both versions.
Alphabet did the same in 2023, when it "updated and simplified" its cost allocation methods and recast prior periods (Q1 2023 earnings release, 8-K exhibit 99.1, accession 0001652044-23-000041). Google Cloud, before and after:
| Google Cloud operating income | As first reported | As restated | Restated in |
|---|---|---|---|
| Fiscal 2021 | loss of $3,099 million | loss of $2,282 million | 10-K 0001652044-24-000022, filed 2024-01-31 |
| Fiscal 2022 | loss of $2,968 million | loss of $1,922 million | 10-K 0001652044-24-000022, filed 2024-01-31 |
Alphabet's consolidated operating income did not change: $78,714 million for 2021 and $74,842 million for 2022 in both versions. The endpoint serves the newest filed value for each segment and year, so you get the restated figures in today's structure, which is what a consistent trend line needs. Two consequences to plan for:
- A long series can cross a seam. A 10-K's segment note typically covers three fiscal years, so a restatement reaches back only so far. Ask for six years of Microsoft and fiscal 2023 comes from a 10-K filed after the change (
dateFiled2025-07-30), while fiscal 2022 comes from the 10-K filed July 30, 2024, before it. Read naively, Intelligent Cloud's operating income falls from $33,203 million to $28,411 million and Productivity and Business Processes jumps from $29,690 million to $50,074 million: a reorganization, not a change in the business. CheckdateFiledagainst the date of the reorganization before you draw a trend line through it. - Restated is not point-in-time. When Microsoft filed its fiscal 2024 10-K on July 30, 2024, the restated figures did not exist yet. A backtest that may only see what was public on a given date needs the as-first-reported numbers from the original filing; /api/filings/search-by-accession-number resolves an accession number to its filing, and our guide to point-in-time data for backtesting covers why the two dates matter. For point-in-time financial statements with the amendment trail on every fact, see the fundamentals API for quants.
What segment data does not tell you
- Segment profit is management's measure. Definitions differ between companies and can change within one, so compare segment margins inside a company first and across companies with care.
- Allocation moves segment margins. Alphabet kept $16,760 million of 2025 costs above its segments. A company that allocates everything shows lower segment margins for the same business.
- Coverage follows the filer's tagging. Most filers tag revenue and operating income per segment; assets, capex, and depreciation are less universal, and a metric is simply absent when it was not tagged.
- The new expense detail is not broken out. The endpoint returns the eight metrics listed above. The significant segment expenses that ASU 2023-07 added are not separate fields.
- Segments are not product lines. A segment can span many products and countries; revenue by product or geography is its own disclosure, served by the revenue segmentation endpoint.
StockFit provides data, not investment advice. Nothing here is a recommendation to buy or sell any security.
FAQ
Q.What is operating income by segment?
Q.Where do I find operating income by segment in a 10-K?
us-gaap:StatementBusinessSegmentsAxis dimension.Q.How do you calculate segment operating margin?
Q.Why doesn't segment operating income add up to consolidated operating income?
Q.Can I get segment data from the SEC EDGAR API?
OperatingIncomeLoss has the consolidated $79,975 million for 2025 and no AWS figure. You either parse each filing's XBRL instance or use an API that has done it.Q.What is a segment recast?
Q.Which Amazon segment makes the most operating income?
Q.Is there an API for operating income by segment?
/api/footnotes/business-segmentation returns revenue, operating income, gross profit, assets, goodwill, depreciation and amortization, capex, and net income per reportable segment and fiscal period, each where the filer tagged it, from 10-K, 10-Q, and 20-F XBRL. It is on the Starter, Stock, and Professional plans (Starter is $19/mo, $15/mo billed annually); Starter returns up to five fiscal years per call.Ready to build?
Free API key, no credit card.