Revenue Segmentation API: Revenue by Geography & Product
Revenue Segmentation API: revenue split by geography and product, period by period, parsed from XBRL dimensional facts in 10-K, 10-Q, and 20-F filings.
Total revenue tells you how big a company is. Where that revenue comes from, which products drive it and which geographies it lands in, tells you how the business actually works, and where the risk sits. That disaggregation is buried in the footnotes of every 10-K, 10-Q, and 20-F as XBRL dimensional facts, and it is one of the hardest things to extract cleanly. The StockFit Revenue Segmentation API, /api/financials/revenue-segmentation, does the extraction for you: one call per ticker returns revenue split by geography and by product, period by period, with every value traceable to a specific SEC filing.
What the Revenue Segmentation API returns
One GET, one stock ticker. The response is an array of periods, newest first. Each period carries its fiscal year and period, the reporting unit, the filing date it came from, and two breakdowns: a structured geography object and a flat product list. You get both axes in a single response, so a revenue-by-geography view and a revenue-by-product view are the same call.
curl "https://api.stockfit.io/api/financials/revenue-segmentation?symbol=AAPL&period=annual&limit=1" \
-H "Authorization: Bearer YOUR_TOKEN"[
{
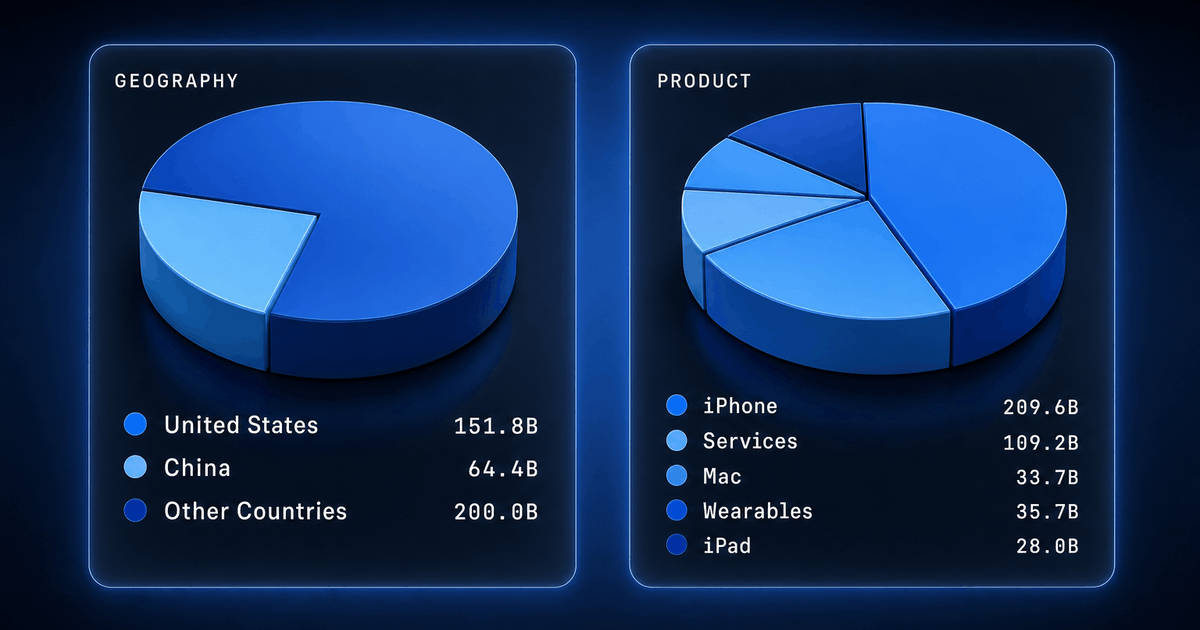
"period": "2025-09-27",
"fiscalYear": 2025,
"fiscalPeriod": "FY",
"unit": "USD",
"geography": {
"countries": [
{ "code": "US", "name": "United States", "continent": "Americas", "value": 151790000000 },
{ "code": "CN", "name": "China", "continent": "Asia", "value": 64377000000 }
],
"usStates": [],
"regions": [],
"residuals": [
{ "member": "aapl:OtherCountriesMember", "name": "Other Countries", "value": 199994000000 }
]
},
"product": [
{ "member": "aapl:IPhoneMember", "name": "iPhone", "value": 209586000000 },
{ "member": "us-gaap:ServiceMember", "name": "Services", "value": 109158000000 },
{ "member": "aapl:WearablesHomeandAccessoriesMember", "name": "Wearables, Home and Accessories", "value": 35686000000 },
{ "member": "aapl:MacMember", "name": "Mac", "value": 33708000000 },
{ "member": "aapl:IPadMember", "name": "iPad", "value": 28023000000 },
{ "member": "us-gaap:ProductMember", "name": "Products", "value": 307003000000 }
],
"dateFiled": "2025-10-31"
}
]That is Apple's fiscal-2025 annual report, disaggregated. The United States and China are broken out as country leaves; everything else is rolled into Apple's own Other Countries member; and the product line runs from iPhone at $209.6B down to iPad at $28.0B. The endpoint is available on the Starter, Stock, and Professional plans.
Revenue by geography: four buckets, no lost dollars
Geography is the messy axis. Filers disclose it inconsistently: some break out individual countries, some give continent-style regions, some tag US states, and many invent their own "rest of world" catch-alls. Rather than flatten all of that into one list and lose the structure, the Revenue Segmentation API partitions geography into four explicit buckets:
- ▹countries — ISO 3166-1 alpha-2 leaves (
country:US,country:CN) with country name and continent. - ▹usStates — US state postal codes (the XBRL
stpr:XXconvention) with the full state name, for filers that disclose by state. - ▹regions — regional rollups the filer tagged directly, like
srt:AmericasMemberorus-gaap:EMEAMember. - ▹residuals — filer-extension catch-alls like
aapl:OtherCountriesMemberthat don't map to a continent. They are surfaced, never dropped.
Countries and regions, reconciled
When a filer discloses both a region and the countries inside it, the two can overlap. To keep the dollars honest, each region carries two extra fields: explainedByCountries (the sum of country leaves whose continent matches the region) and other (the region total minus that sum). That lets you surface an "other countries in region" bucket without double-counting and without losing the residual. Continent attribution is only applied to true top-level rollups (Americas, Europe, Asia, Africa, Oceania), so a generic Non-US bucket is reported as-is rather than guessed at:
// MSFT FY2025 geography — a US leaf plus a Non-US region
"geography": {
  "countries": [
    { "code": "US", "name": "United States", "continent": "Americas", "value": 144546000000 }
  ],
  "usStates": [],
  "regions": [
    {
      "member": "us-gaap:NonUsMember",
      "name": "Non-US",
      "continent": null,
      "value": 137178000000,
      "explainedByCountries": 0,
      "other": 137178000000
    }
  ],
  "residuals": []
}
Microsoft splits revenue simply into US ($144.5B) and Non-US ($137.2B). Because Non-US is not a real continent, continent is null and the whole region total flows to other rather than being falsely attributed to any country. Coca-Cola (KO) discloses the same way: US $19.1B alongside a Non-US region of $28.8B. Apple, by contrast, names the United States and China outright and rolls the rest into a residual, which is why its geography lands in countries + residuals instead of regions.
Revenue by product: subtotals preserved, not pruned
The product field is a flat list of revenue-by-product members exactly as the filer tagged them. We deliberately do not prune subtotals, because the "right" level of aggregation depends on what you are building. Apple, for example, tags both the us-gaap:ProductMember rollup ($307.0B of total products) and its individual lines (iPhone, Mac, iPad, Wearables), plus a Services line ($109.2B). The parent and the leaves both come back; you collapse whichever level you don't want client-side.
Tesla (TSLA) is the textbook overlap case: it tags an Automotive Revenues parent of $69.5B that is itself the sum of Automotive Sales ($65.8B), Leasing ($1.7B), and Regulatory Credits ($2.0B), each tagged separately. Knowing which member is the subtotal matters, and preserving both lets you choose. Not every company even discloses geography on the revenue axis: Nike (NKE) tags only products, so its geography buckets come back empty while product returns Footwear ($31.0B), Apparel ($13.0B), Sporting Equipment ($2.2B), and Other.
Where the revenue segmentation data comes from
Every value originates in a filing, not a data vendor. When a company files a 10-K, 10-Q, or 20-F with the SEC, the disaggregated-revenue footnote is tagged in XBRL as dimensional facts: a revenue concept (for US-GAAP filers, usually RevenueFromContractWithCustomerExcludingAssessedTax; for IFRS 20-F filers, ifrs-full:Revenue) reported against a member on a geography or product axis. StockFit runs each filing through Arelle, the open-source XBRL processor, and extracts those facts directly. The same single-axis machinery reads other dimensions too: the class-of-stock axis is how we extract EPS and share count for multi-class filers like Visa, where there is no consolidated total to read.
The extraction is deliberately conservative. It keeps single-axis facts only (revenue tagged on exactly one breakdown axis), because 10-K XBRL does not generally tag "iPhone revenue in the US" as a single crossed fact, it tags iPhone on the product axis and US on the geography axis as separate rows. Pure-qualifier axes like consolidation-items are excluded so reconciliation scaffolding does not leak into the data. Each fact is period-classified (FY, Q1–Q4, plus cumulative H1 and 9M) against the company's real fiscal-year end, then written to a dimensional_facts table keyed so that restatements insert as new rows and the newest-filed value wins. The geography bucketing, continent attribution, and label cleanup all happen at read time, so the same raw fact can be reshaped without re-ingesting.
That newest-filed-wins rule is also a point-in-time guarantee: the dateFiled on every period is the original filing's acceptance date, and an amendment never silently overwrites history. If you are building backtests on top of this, the point-in-time fundamentals and amendment audit trail post explains the model in depth.
Quarterly revenue segmentation and the missing quarters
Pass period=quarter and the endpoint returns Q1 through Q4. There is a catch baked into how 10-Qs work, and the API handles it for you: a 10-Q reports cumulative figures, not standalone quarters. The Q2 filing discloses six-month (H1) revenue; the Q3 filing discloses nine-month (9M) revenue. So a clean standalone Q2 has to be synthesized as H1 − Q1, and Q3 as 9M − H1. The Revenue Segmentation API does that subtraction per member, per axis, and drops the H1/9M scaffolding rows from the response, so you receive four real quarters rather than a pile of cumulative totals you have to unwind yourself.
This is the same family of period-reconstruction problems that makes raw SEC XBRL hard to use directly, the missing fourth quarter, fiscal-calendar drift, instant-versus-duration periods. Our guide to converting XBRL financials to JSON walks through each one. Segment revenue is one of several SEC EDGAR alternative data signals a small quant pod can extract straight from filings.
Revenue segmentation vs. business segmentation
StockFit ships a sibling endpoint, /api/financials/business-segmentation, and the two answer different questions. Revenue segmentation answers "where does the revenue come from?" across geography and product, revenue only. Business segmentation answers "how does each operating segment perform?" and returns up to eight metrics per segment: revenue, operating income, gross profit, total assets, goodwill, depreciation and amortization, capex, and net income.
// /api/financials/business-segmentation?symbol=MCK — one segment, multiple metrics
{
  "member": "mck:NorthAmericanPharmaceuticalSegmentMember",
  "name": "North American Pharmaceutical Segment",
  "metrics": {
    "revenue": 336652000000,
    "goodwill": 2781000000,
    "depreciationAmortization": 134000000,
    "capex": 334000000
  }
}
McKesson's North American Pharmaceutical segment alone books $336.7B in revenue, with goodwill, D&A, and capex tagged alongside it. A metric is simply absent when the filer didn't tag that concept for that segment. Reach for business segmentation when you want per-division profitability; reach for revenue segmentation when you want the geographic and product mix of the top line.
How to call the Revenue Segmentation API
It is a single GET. symbol is required and resolves both tickers and CIKs. period is annual (default) or quarter. limit (1–80, default 4) caps how many periods come back and is clamped by your subscription tier. Because subtotals are preserved, a common first step is to separate parent rollups from leaves:
const periods = await fetch(
  'https://api.stockfit.io/api/financials/revenue-segmentation?symbol=AAPL',
  { headers: { Authorization: 'Bearer ' + token } }
).then(r => r.json());

const latest = periods[0];

// Collapse the us-gaap rollups, keep the issuer-specific product leaves
const PARENT_ROLLUPS = new Set(['us-gaap:ProductMember', 'us-gaap:ServiceMember']);
const productLeaves = latest.product.filter(p => !PARENT_ROLLUPS.has(p.member));

// Total non-US revenue from whichever shape the filer used
const geo = latest.geography;
const nonUs =
  geo.regions.find(r => r.member === 'us-gaap:NonUsMember')?.value
  ?? geo.residuals.reduce((s, r) => s + r.value, 0);
The revenue figures here come from the same curated fundamentals that power /api/financials/income-statement and /api/financials/key-metrics, so the segmented totals reconcile to the headline revenue you pull elsewhere. To benchmark a company's mix against its competitors, pair this with the Company Peers API and run the same call across the peer set. The endpoint is also exposed as an MCP tool, so the same key works inside Claude, Cursor, and VS Code.
FAQ
What is a revenue segmentation API?
A revenue segmentation API returns a company's revenue broken down by sub-category instead of as a single top-line number. The StockFit Revenue Segmentation API, /api/financials/revenue-segmentation, returns revenue split by geography (countries, US states, regional rollups, and residual catch-alls) and by product, period by period, in one call per ticker. Every value is parsed from XBRL dimensional facts in the company's 10-K, 10-Q, or 20-F filings.
Where does the revenue segmentation data come from?
From SEC EDGAR filings directly. Companies tag their disaggregated-revenue footnotes as XBRL dimensional facts, a revenue concept reported against a member on a geography or product axis. StockFit processes each 10-K, 10-Q, and 20-F through the Arelle XBRL engine, keeps the single-axis revenue facts, classifies each into a fiscal period, and stores them so the newest-filed value wins. There are no third-party aggregators in the path.
How is revenue by geography structured?
Into four buckets: countries (ISO 3166-1 leaves with continent), usStates (US postal codes for state-level disclosure), regions (filer-tagged rollups like Americas or EMEA), and residuals (extension catch-alls like "Other Countries"). Each region also carries explainedByCountries and other so country leaves and their parent region reconcile without double-counting. No disclosed value is ever dropped.
Why do some products overlap, like Products and iPhone both appearing?
Because filers tag both the subtotal and its components, and the endpoint preserves both rather than guessing which level you want. Apple tags a us-gaap:ProductMember rollup of $307B alongside iPhone, Mac, iPad, and Wearables; Tesla tags an Automotive Revenues parent that equals the sum of Automotive Sales, Leasing, and Regulatory Credits. You collapse whichever level you don't need client-side using the member field.
Does the Revenue Segmentation API return quarterly data?
Yes. Pass period=quarter to get Q1 through Q4. Because 10-Q filings report cumulative six-month (H1) and nine-month (9M) figures rather than standalone quarters, the API synthesizes Q2 as H1 minus Q1 and Q3 as 9M minus H1, per member, and drops the cumulative scaffolding. You receive four real standalone quarters.
What is the difference between revenue segmentation and business segmentation?
Revenue segmentation (/api/financials/revenue-segmentation) splits the top line by geography and product, revenue only. Business segmentation (/api/financials/business-segmentation) returns up to eight metrics per operating segment, revenue, operating income, gross profit, assets, goodwill, D&A, capex, and net income, so you can measure per-division profitability. Use the first for revenue mix, the second for segment performance.
Which subscription tiers include the Revenue Segmentation API?
The Starter ($15/mo), Stock ($39/mo), and Professional ($69/mo) plans. You can get a token from the StockFit dashboard and call it immediately, no credit card required to sign up.
Ready to build?
Free API key, no credit card. Every endpoint mentioned in this post is available on the free tier.