XBRL Financials to JSON: Guide for Backtesting
Why SEC XBRL is hard to use directly, what "as-reported" really means, and how to assemble a clean point-in-time dataset for systematic strategies.
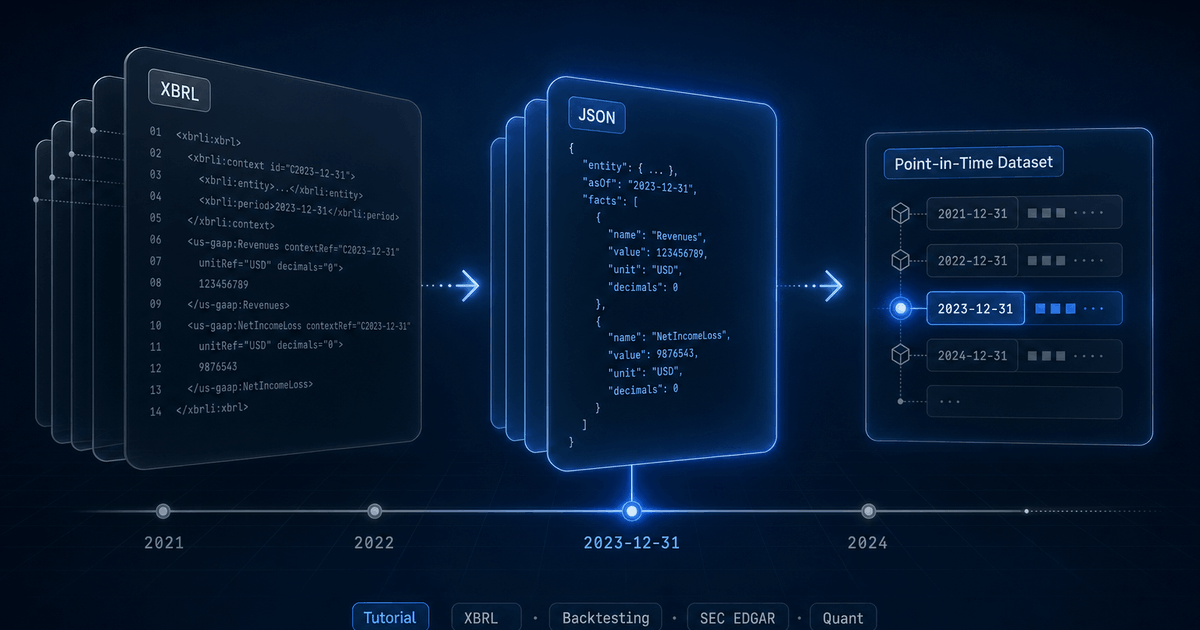
Every public US company files financial data to the SEC in XBRL — a tagged XML format designed for machines. In theory, that means you can grab Apple's revenue history, Tesla's cash flows, or every regional bank's loan book directly from EDGAR, for free, in a structured form.
In practice, anyone who has tried to feed raw XBRL into a backtester has discovered the data is a minefield: thousands of overlapping concept names, dimensional facts that look duplicated but are not, fiscal calendars that drift across years, and a missing fourth quarter that has to be derived. This guide walks through what the format actually contains, the parsing pipeline that turns it into usable JSON, and a practical workflow for backtesting against point-in-time fundamentals. (For a higher-level tour of the SEC filings the pipeline reads — 10-K, 10-Q, 8-K, S-1, and the rest — see the companion SEC Forms field guide.)
What XBRL actually is
XBRL (eXtensible Business Reporting Language) is XML with a heavy domain layer on top. A 10-K filing typically ships several documents: an instance file with the actual numbers, a taxonomy schema that defines the concepts, and link bases that describe how concepts relate (presentation, calculation, definition, label). The SEC mandates the us-gaap taxonomy plus an issuer-specific extension taxonomy where companies coin their own concepts.
Each fact in the instance document carries a concept name, a value, a unit, a context (period and entity), an optional set of dimensions (axis → member pairs), a precision/decimals attribute, and a language for narrative facts. A single 10-K can contain six to ten thousand facts.
<us-gaap:Revenues
    contextRef="FD2024Q4YTD"
    unitRef="USD"
    decimals="-6"
    id="fact-001">383285000000</us-gaap:Revenues>

<context id="FD2024Q4YTD">
  <entity><identifier scheme="...">0000320193</identifier></entity>
  <period>
    <startDate>2023-10-01</startDate>
    <endDate>2024-09-28</endDate>
  </period>
</context>
That single fact tells you Apple reported $383.285B in revenue for the fiscal year ending September 28, 2024, with rounding to the nearest million. To make use of that programmatically, you need to dereference the context, parse the dates, normalize the unit, and decide whether this concept (us-gaap:Revenues) maps to your internal revenue field. Now do that for every concept in every filing for every company.
Five problems no one warns you about
Once you start parsing real filings at scale, the same five issues come up repeatedly. Each one looks like a quirk; collectively they are the reason “just download EDGAR” is not a viable backtesting strategy.
1. Concept proliferation
Revenue is not a single concept. The us-gaap taxonomy alone contains Revenues, SalesRevenueNet, SalesRevenueGoodsNet, SalesRevenueServicesNet, RevenueFromContractWithCustomerExcludingAssessedTax, and a dozen more. Different companies, and the same company across years, pick different concepts. Some report a single top-line; others report two or three component concepts that sum to revenue.
Issuer-specific extension taxonomies make it worse. Tesla has reported revenue through tsla:AutomotiveSalesRevenue and similar custom concepts. Without a mapping layer, a naive parser will silently miss data for entire companies.
2. Dimensional facts
Many facts carry dimensions: an axis paired with a member. us-gaap:Revenues with us-gaap:StatementBusinessSegmentsAxis = tsla:AutomotiveSegmentMember is segment-level revenue. The same concept without dimensions, in the same filing, is consolidated revenue. They are not duplicates — one rolls up into the other.
For a top-of-statement backtest you want only non-dimensional facts. For a segment-aware strategy you want exactly the dimensional ones. Get this wrong and you'll silently double-count or attribute consolidated metrics to a single segment. The trap runs the other way too: for multi-class issuers like Visa, EPS and share count exist only as dimensional facts, so dropping them leaves you with no EPS at all — see extracting EPS and share count with Arelle.
3. Period classification (instant vs duration)
Balance sheet items are instants (a value at a point in time). Income statement and cash flow items are durations (a value over a period). The XBRL context tells you which, but the period itself can be ambiguous: a 10-Q for Q3 contains a Q3-only duration and a year-to-date (9-month) cumulative duration for the same concept. They look identical except for their start dates.
| Duration | Means | Comes from |
|---|---|---|
| ~365 days | FY (annual) | 10-K, plus first 9 months on the 10-Q |
| ~270 days | 9M (year-to-date through Q3) | Q3 10-Q |
| ~180 days | H1 (year-to-date through Q2) | Q2 10-Q |
| ~90 days | A single quarter | Any 10-Q (the discrete quarter) |
| 0 days | Instant (balance sheet snapshot) | Any filing |
Classifying every fact by period type is non-negotiable. If you load all duration facts as “quarterly”, your Q3 revenue will be triple-counted because the year-to-date cumulative is also in there.
4. Fiscal calendars
About a third of S&P 500 companies do not use a December fiscal year. Apple ends in late September; Costco in late August; Walmart in late January. Many use a 52/53-week calendar that drifts by a few days each year, so the actual fiscal year-end might be September 28 one year and September 27 the next.
Naively grouping facts by calendar year breaks any cross-company comparison. You need fiscal-year-aware classification: for a company with an August fiscal year-end, a fact ending September 2025 belongs to fiscal year 2026, not 2025. And the 52/53-week drift means you need a small grace window around the nominal month boundary.
5. The missing Q4
This one trips up almost every first-time XBRL parser. Q4 is not directly reported. The 10-K contains the full-year FY duration, and the three 10-Qs contain Q1, Q2, and Q3. To get a discrete Q4 income statement, you have to subtract.
Q4 = FY (10-K) - 9M (Q3 10-Q)
   = FY - H1 - Q3                  (fallback if 9M is missing)
   = FY - Q1 - Q2 - Q3             (fallback if H1 is missing too)
This sounds simple until you handle restatements, late-filed 10-Q/As, or mid-year fiscal changes. Reconstruction has to be deterministic and idempotent — backtests need stable history, not values that flip every time a company files an amendment.
Parsing XBRL with Arelle
The de facto open-source XBRL processor is Arelle. It is mature, taxonomy-aware, used by regulators, and can run as a CLI or as a long-running web service. Arelle handles the things you do not want to reimplement: schema resolution, taxonomy caching, label resolution across labelLink files, and dimension validation.
# Spawn Arelle as a local web server
arelleCmdLine --webserver localhost:8080

# Fetch facts as JSON for a specific filing instance
URL="https://www.sec.gov/Archives/edgar/data/320193/.../aapl-20240928.htm"
ENC=$(node -e "console.log(encodeURIComponent(process.argv[1]))" "$URL")
curl "http://localhost:8080/rest/xbrl/$ENC/facts?media=json&factListCols=Name,contextRef,unitRef,Dec,Lang,Value,Period,Dimensions"
The response is a JSON array, one entry per fact, with resolved start/end dates instead of raw context references. From there it is “just” an iteration problem: filter, classify, normalize, store.
Filtering before you store anything
Not every fact is worth keeping. For financial filings the rules we apply are roughly:
- Drop language-tagged narrative facts (risk-factor text, accounting-policy paragraphs).
- Drop facts without a
decimalsattribute — usually unit-less metadata. - For top-line statements, keep non-dimensional numeric facts only; route dimensional facts to a separate segments table.
- Skip prior-year comparative balance-sheet snapshots that appear inside a current filing — they are the same numbers already stored against the prior filing.
Naive parser
Revenues tag as “revenue”. Triple-counts Q3 from cumulative facts. Misses Tesla's extension-taxonomy revenue concepts entirely.Production parser
“As-reported” vs normalized: a real distinction
Financial data vendors generally pick one of two postures, and the choice has direct backtesting consequences.
Heavily normalized / "adjusted"
As-reported with curated mapping
revenue is always revenue), but the underlying numbers are exactly what the issuer filed. Restatements are visible because old filings stay queryable.Backtests need the second posture. You are simulating what an algorithm would have decided with the data available on a given historical date. Adjusted numbers from a future restatement are look-ahead bias by another name. For a live, worked example of lookahead bias from restated financials (Plug Power's fiscal-2018 loss moving two years after the fact), see the companion post.
StockFit exposes both views. /api/financials/as-reported returns the full raw fact set with its original concept names, dimensions, and source filing reference. /api/financials/income-statement, /api/financials/balance-sheet, and /api/financials/cash-flow-statement return the curated, canonical view — same underlying values, but with stable field names so your code does not break when an issuer switches concepts between filings.
A stable contract for code: curated facts
The bridge between the messy XBRL world and clean JSON is a mapping layer: each company's set of reported concepts is mapped onto a stable list of canonical fields (revenue, costOfRevenue, operatingIncome, cashAndEquivalents, and so on). Two principles make this layer trustworthy:
- Mapping is per-company, not global. Tesla's mapping for
revenuemay pull fromtsla:AutomotiveSalesRevenue+tsla:ServicesAndOtherRevenue; Apple's pulls from a singleus-gaap:RevenueFromContractWithCustomerExcludingAssessedTax. A one-size-fits-all mapping silently loses data. - Mappings are versioned and re-derivable. When a company changes the concepts it reports under (which they do, especially around accounting standard changes like ASC 606), the mapping updates and historical periods are re-mapped against the new definition. Backtests must be reproducible across runs.
We also derive a small set of fields from related facts when the company does not report them directly. grossProfit is computed from revenue - costOfRevenue; workingCapital from currentAssets - currentLiabilities; ebit from a chain of fallbacks (operatingIncome + otherExpenses, then netIncome + interestExpense + incomeTaxExpense). The derived fields are flagged in the response so a backtest can choose to use only directly-reported values if needed.
Reconstructing Q4 deterministically
Reconstruction is a read-time operation, not a write-time one. Storing a synthesized Q4 in the same table as native quarters means a future restatement of either the 10-K or the Q3 10-Q makes your Q4 stale until the next ingest. Computing Q4 at query time keeps it consistent with whatever the most recent FY and 9M values actually are.
The reconstruction is the chain shown earlier: prefer FY - 9M, fall back to FY - H1 - Q3, fall back to FY - Q1 - Q2 - Q3. Reconstruction happens after the curated mapping, so it works on canonical fields rather than on raw concept names — which means it stays correct across companies whose 9M facts come from different XBRL concepts.
For balance sheet items there is no reconstruction needed: instants from the 10-K already represent fiscal year-end snapshots, and instants from a 10-Q are quarter-end snapshots.
Point-in-time semantics
Every backtest needs an honest answer to: “what did I know on date D?” For SEC fundamentals, the answer is governed by the filing date, not the period-end date. A 10-K for fiscal year ending December 31, 2024 might not be filed until late February 2025. Using its values to make a January 2025 trade is look-ahead.
Each financials response carries the original SEC filing date inline as a top-level dateFiled field on every period — always the original 10-K, 10-Q, 20-F, or 40-F, never an amendment. Backtests filter on it directly: WHERE dateFiled <= backtest_date. No separate join with the filings endpoint is needed.
Amendments are the deeper trap. If a company files an original 10-K and later files a 10-K/A that restates a value, most APIs silently overwrite the original facts and your backtest trades on the corrected number weeks before the market saw it. To eliminate this, the response's sources map carries the full chronological filing trail per period, and every restated fact carries a { before: <prior-value> } entry on the amendment that changed it. Walk that map in reverse, undo any amendment dated after your backtest date, and the panel you get is mathematically lookahead-free. The Holy Grail API for Stock Backtesting walks through the unwind algorithm with code.
End-to-end: a backtesting workflow
Here is the shape of a typical workflow using the StockFit API. The example builds a simple quality-and-value screen rebalanced quarterly, but the same pattern works for any fundamentals strategy.
1. Pull the universe of symbols
curl -H "Authorization: Bearer $STOCKFIT_KEY" \
  "https://api.stockfit.io/v1/api/symbols?exchange=NASDAQ&pageSize=1000"
2. For each symbol, fetch a curated income statement
curl -H "Authorization: Bearer $STOCKFIT_KEY" \
  "https://api.stockfit.io/v1/api/financials/income-statement?\
symbol=AAPL&period=quarter&limit=4"
The response is a flat array, one entry per fiscal period. period is the period_end date; fiscalYear and fiscalPeriod classify the period (FY, Q1, Q2, Q3, Q4); dateFiled is the original SEC filing date for the period (always the original 10-K, 10-Q, 20-F, or 40-F, never an amendment); facts is a map of canonical field names; sources is the per-fact, per-filing audit trail; derived lists the facts that were synthesized rather than tagged directly. Missing values come back as the literal string "N/A" so a key always exists. Quarter alignment is already fiscal-year-aware — below, Apple's December period is fiscal Q1 2026 because Apple's fiscal year ends in late September.
[
  {
    "period": "2025-12-26",
    "fiscalYear": 2026,
    "fiscalPeriod": "Q1",
    "dateFiled": "2026-01-30",                // The gate: only use these facts at backtest dates >= 2026-01-30.
    "facts": {
      "revenue":         143756000000,
      "costOfRevenue":    74525000000,
      "grossProfit":      69231000000,
      "operatingIncome":  50852000000,
      "netIncome":        42097000000,
      "eps":              2.85,
      "ebitda":           54066000000,
      "interestExpense":  "N/A"
    },
    "sources": {
      "0000320193-26-000006": {
        "type": "10-Q",
        "dateFiled": "2026-01-30",
        "amendment": false,
        "facts": {
          "revenue": {},                      // Empty {} = original value, never restated.
          "costOfRevenue": {},
          "operatingIncome": {},
          "netIncome": {},
          "eps": {}
        }
      }
    },
    "derived": ["grossProfit", "ebitda"]
  }
]
3. Combine with balance sheet and cash flow
# Same shape, swap the path
curl -H "Authorization: Bearer $STOCKFIT_KEY" \
  "https://api.stockfit.io/v1/api/financials/balance-sheet?symbol=AAPL&period=quarter&limit=40"

curl -H "Authorization: Bearer $STOCKFIT_KEY" \
  "https://api.stockfit.io/v1/api/financials/cash-flow-statement?symbol=AAPL&period=quarter&limit=40"
4. Build a point-in-time panel
const KEY = process.env.STOCKFIT_KEY;
const BASE = 'https://api.stockfit.io/v1/api';
const headers = { Authorization: `Bearer ${KEY}` };

const get = async (path, params) => {
  const url = new URL(BASE + path);
  for (const [k, v] of Object.entries(params)) url.searchParams.set(k, v);
  const r = await fetch(url, { headers });
  if (!r.ok) throw new Error(`${r.status} ${url}`);
  return r.json();
};

// Load curated quarterly income statement; coerce "N/A" → null. dateFiled
// already lives on each period entry, so no separate /api/filings call is needed.
async function loadFinancials(symbol) {
  const rows = await get('/financials/income-statement', {
    symbol, period: 'quarter', limit: 40,
  });
  return rows.map(({ period, dateFiled, facts }) => ({
    symbol, period, dateFiled,
    ...Object.fromEntries(
      Object.entries(facts).map(([k, v]) => [k, v === 'N/A' ? null : v])
    ),
  }));
}

const universe = ['AAPL', 'MSFT', 'GOOG', 'NVDA'];
const panel = (await Promise.all(universe.map(loadFinancials))).flat();

// As-of query: what did we know on 2024-06-30?
const asof = '2024-06-30';
const visible = panel.filter(r => r.dateFiled && r.dateFiled <= asof);

// Trailing-twelve-month revenue per symbol (latest 4 visible quarters by dateFiled).
const bySymbol = new Map();
for (const r of visible.sort((a, b) => a.dateFiled.localeCompare(b.dateFiled))) {
  if (!bySymbol.has(r.symbol)) bySymbol.set(r.symbol, []);
  bySymbol.get(r.symbol).push(r);
}
const ttm = [...bySymbol].map(([symbol, rows]) => ({
  symbol,
  ttmRevenue: rows.slice(-4).reduce((s, r) => s + (r.revenue ?? 0), 0),
}));
console.table(ttm);
The point-in-time filter on dateFiled is what makes the result honest. Because dateFiled is an ISO YYYY-MM-DD string, lexicographic comparison is also chronological comparison — no date library needed. To also unwind future restatements at the asof date, walk the period's sources map and roll any fact with a { before: N } entry on an amendment dated after asof back to N. The Holy Grail API for Stock Backtesting shows the full unwind algorithm. Run with Node 18+ (native fetch) and top-level await in an ESM module.
5. Walk forward across rebalance dates
// Generate quarterly rebalance dates (2018-Q1 through 2025-Q1)
function quarterlyDates(start, end) {
  const out = [];
  for (let d = new Date(start); d <= end; d.setMonth(d.getMonth() + 3)) {
    out.push(new Date(d));
  }
  return out;
}

const rebalanceDates = quarterlyDates(new Date('2018-01-01'), new Date('2025-01-01'));
const positions = [];

for (const d of rebalanceDates) {
  const asof = d.toISOString().slice(0, 10);
  const visible = panel.filter(r => r.dateFiled && r.dateFiled <= asof);
  // Latest visible quarter per symbol (sorted ascending by dateFiled string).
  const latest = new Map();
  for (const r of visible.sort((a, b) => a.dateFiled.localeCompare(b.dateFiled))) {
    latest.set(r.symbol, r);
  }
  // Toy ranking: highest gross margin
  const ranked = [...latest.values()]
    .filter(r => r.revenue && r.grossProfit)
    .map(r => ({ ...r, margin: r.grossProfit / r.revenue }))
    .sort((a, b) => b.margin - a.margin)
    .slice(0, 20)
    .map(r => r.symbol);
  positions.push({ date: asof, longs: ranked });
}

// Hand off to your favourite backtester
console.log(positions[0]);- Using
periodinstead ofdateFiled— bakes in look-ahead. - Forgetting that fiscal years are not calendar years — ranking Apple FY2024 (ends Sep 2024) against a calendar-2024 universe distorts cross-sectional comparisons.
- Treating
"N/A"as a number — the API returns it as a string for missing facts. Coerce toNone/NaNbefore any arithmetic. - Ignoring amendments — if a 10-K/A in 2026 restates a 2024 value, using the post-restatement number for a 2025 backtest is silent look-ahead. Walk
sources[*].facts.*.beforeon amendments dated after the backtest date and roll back. See the Holy Grail post for the algorithm.
FAQ
What is XBRL and why does the SEC use it?
XBRL (eXtensible Business Reporting Language) is XML with a heavy domain layer on top, designed for tagging financial facts with semantic meaning. The SEC mandates that public companies file their 10-K, 10-Q, and 20-F financial statements in XBRL alongside the human-readable HTML, so machines can read the same numbers consistently. Each fact carries a concept name, value, unit, period, and dimensional context. The SEC Forms field guide covers which filings are XBRL-tagged.
Why is raw XBRL hard to use directly?
Five reasons: (1) concept proliferation — thousands of overlapping us-gaap concepts plus issuer-specific extensions; (2) dimensional facts that look duplicated but are not; (3) period classification (instant vs duration) that requires interpretation; (4) fiscal calendars that drift across years; (5) the missing fourth quarter that has to be derived from FY minus 9M values. The body of this post walks through each one with examples.
What is the difference between as-reported and normalized fundamentals?
As-reported preserves the original XBRL concept name and value exactly as the issuer filed them — no remapping, no reformatting. Normalized maps issuer-specific concepts onto a stable canonical schema (revenue, netIncome) so queries work identically across thousands of companies. Both are valuable: as-reported for audit, normalized for analytics. StockFit returns both via /api/financials/as-reported and the standardized /api/financials/income-statement.
How do you reconstruct Q4 from XBRL filings?
Q4 is not directly reported. The 10-K contains the full-year FY duration, and the three 10-Qs contain Q1, Q2, and Q3. The deterministic reconstruction is: prefer FY − 9M, fall back to FY − H1 − Q3, fall back to FY − Q1 − Q2 − Q3. Reconstruction happens at read time on canonical fields (after curated mapping) so it stays correct across companies that use different XBRL concepts for their 9M facts.
Wrapping up
XBRL is structured data with a long tail of edge cases. The work between “XML on EDGAR” and “clean JSON your strategy can iterate over” is real and ongoing — new accounting standards, new issuer extensions, new corporate actions. If you'd rather not maintain that pipeline yourself, the StockFit API exposes both the raw fact set and a curated, point-in-time, fiscal-year-aware JSON view of every US public company.
- /api/financials/as-reported — full raw fact set, traceable to the source filing.
- /api/financials/income-statement, /balance-sheet, /cash-flow-statement — curated, canonical fields keyed by fiscal-period-end. Each period carries
dateFiledand a per-factsourcesaudit trail withbeforevalues for restated facts, so point-in-time and amendment-aware backtests come for free without a separate filings join. - /api/financials/key-metrics, /growth, /scores — derived ratios and quality signals computed off the same underlying facts.
- /api/filings, /api/filings/document, /api/filings/item — filing metadata and section extraction when a strategy needs to read the underlying 10-K or 10-Q text.
Full reference is at api.stockfit.io/docs. The free tier is enough to prototype most backtesting workflows end-to-end. If you build something interesting, send a note to info@stockfit.io — we read everything.
Related reading on this site: Insights — AI-generated company deep dives built using exactly the workflow described above.
Ready to build?
Free API key, no credit card. Every endpoint mentioned in this post is available on the free tier.