Level 3 Assets by Company: Who Marks to Model
Level 3 assets by company from SEC filings: a fair value hierarchy API for Level 1, 2, and 3 at banks, insurers, and alternative asset managers.
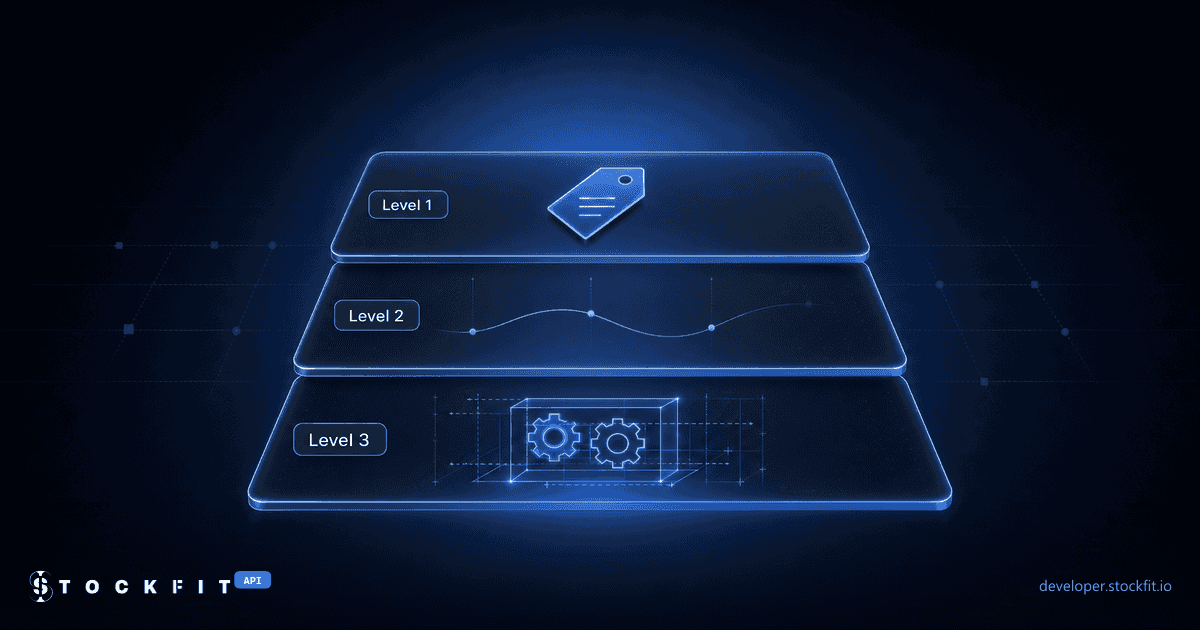
At the end of 2025, Apollo Global Management carried $152.1 billion of assets at fair value measured with significant unobservable inputs: its own models and assumptions instead of market quotes. That is more than twice the $70.4 billion that JPMorgan Chase, Bank of America, Wells Fargo, Goldman Sachs, and Morgan Stanley reported combined. These are Level 3 assets, the bottom tier of the fair value hierarchy, and every figure in that comparison comes straight from the companies' own 10-K filings.
Getting those figures is harder than it looks. SEC's free XBRL API returns Goldman Sachs' total assets at fair value and says nothing about how much of it is Level 3, because the levels are reported on an XBRL dimension that the API leaves out. /api/footnotes/fair-value-hierarchy returns Level 1, Level 2, Level 3, and NAV amounts per company and balance date, plus a derived Level 3 share. Below: what Level 3 means, why SEC's own API cannot answer the question, a real response for Goldman Sachs, Level 3 assets by company for 13 banks, insurers, alternative asset managers, and a business development company (BDC), how to track the series point-in-time, and a short screener.
What are Level 3 assets? The fair value hierarchy in brief
ASC 820, the US GAAP standard for fair value measurements, sorts every asset and liability a company carries at fair value into three levels, by the inputs behind the price:
| Level | Inputs | Typical examples |
|---|---|---|
| Level 1 | Quoted prices in active markets for identical assets | Exchange-listed stocks, US Treasury securities, listed futures |
| Level 2 | Observable market data other than Level 1 quotes: prices for similar assets, yield curves, interest rates | Most corporate bonds, interest rate swaps, agency mortgage-backed securities |
| Level 3 | Significant unobservable inputs: the company's own assumptions | Private loans and private equity stakes, illiquid structured credit, complex derivatives |
Level 3 is what people mean by mark to model. With no market price to point to, the value comes from valuation techniques such as discounted cash flow models or market multiples, fed with inputs like discount rates and projected cash flows that management chooses. The disclosure requirements scale with that judgment: for recurring Level 3 measurements, filers add a reconciliation of the opening and closing balance and quantitative information about the significant unobservable inputs. The level describes how a price was measured. It does not say whether the asset is good or bad.
Why SEC's XBRL API can't return Level 3 assets
The obvious first stop is SEC's own XBRL API. Ask it for Goldman Sachs' AssetsFairValueDisclosure:
curl -A "your-app you@example.com" \
  "https://data.sec.gov/api/xbrl/companyconcept/CIK0000886982/us-gaap/AssetsFairValueDisclosure.json"
The 2025 year-end entry from the 10-K, trimmed from the response:
{
  "end": "2025-12-31",
  "val": 963966000000,
  "accn": "0000886982-26-000091",
  "fy": 2025,
  "fp": "FY",
  "form": "10-K",
  "filed": "2026-02-25"
}
That is the total, $963,966 million of financial assets at fair value, and it is the only figure the response holds for that date, repeated once for each filing that reported it. The Level 3 slice sits in the same filing, reported on a dimension. Here is the raw fact from the 10-K's XBRL instance:
<context id="c-74">
  <entity>
    <identifier scheme="http://www.sec.gov/CIK">0000886982</identifier>
    <segment>
      <xbrldi:explicitMember dimension="us-gaap:FairValueByFairValueHierarchyLevelAxis">us-gaap:FairValueInputsLevel3Member</xbrldi:explicitMember>
    </segment>
  </entity>
  <period>
    <instant>2025-12-31</instant>
  </period>
</context>

<us-gaap:AssetsFairValueDisclosure contextRef="c-74" decimals="-6" id="f-570" unitRef="usd">20324000000</us-gaap:AssetsFairValueDisclosure>
SEC's EDGAR API documentation says the XBRL APIs aggregate facts that use a standard taxonomy and "apply to the entire filing entity." In practice that leaves out facts qualified by a dimension member such as FairValueInputsLevel3Member: the same criteria cover companyconcept, companyfacts, and frames, which is why the response above has Goldman's total and no level breakdown. To get the split yourself, you download each filing's XBRL instance, resolve every context to its dimension members, keep the facts whose only dimension is the hierarchy level, and repeat that for every company and balance date. That is the same dimensional trap our post on extracting EPS with Arelle hit with per-share-class EPS.
The fair value hierarchy API: Level 1, 2, and 3 in one call
One request per company and period type. Here is Goldman Sachs, latest fiscal year:
curl "https://api.stockfit.io/v1/api/footnotes/fair-value-hierarchy?symbol=GS&period=annual&limit=1" \
-H "Authorization: Bearer $STOCKFIT_API_KEY"[
{
"period": "2025-12-31",
"fiscalYear": 2025,
"fiscalPeriod": "FY",
"measures": [
{
"measure": "assets",
"concept": "us-gaap:AssetsFairValueDisclosure",
"currency": "USD",
"level1": 515386000000,
"level2": 473090000000,
"level3": 20324000000,
"level3Share": 0.02014670896114195
},
{
"measure": "liabilities",
"concept": "us-gaap:LiabilitiesFairValueDisclosure",
"currency": "USD",
"level1": 140556000000,
"level2": 648454000000,
"level3": 32130000000,
"level3Share": 0.039128528630927736
}
],
"dateFiled": "2026-08-03"
}
]Each measure is one table from the fair value footnote:
| Field | What it is |
|---|---|
| measure | Which fair value table the row comes from: assets, liabilities, cashEquivalents, investments, afsSecurities, htmSecurities, derivativeAssets, derivativeLiabilities. Present only when the filer tagged it. |
| concept | The US GAAP concept behind the measure, for example us-gaap:AssetsFairValueDisclosure. |
| level1 / level2 / level3 | Amounts measured with quoted prices, observable inputs, and significant unobservable inputs. Levels the filer did not tag are omitted. |
| nav | Amounts measured at net asset value as a practical expedient, which sit outside the three levels. |
| total | The total the filer tagged without a level member, when it tags one. |
| level3Share | level3 / (level1 + level2 + level3). NAV and netting are not in the denominator. |
| dateFiled | Filing date of the newest filing that reported this balance date. |
The three levels match Goldman's fiscal 2025 10-K to the dollar: $515,386 million, $473,090 million, and $20,324 million (accession 0000886982-26-000091). Goldman's own table then adds $1,739 million of investments in funds at NAV, which it tags with its own extension member rather than the standard NAV member (so the response has no nav field), and subtracts $46,573 million of counterparty and cash collateral netting to reach the $963,966 million total.
That changes the ratio. Goldman divides Level 3 by the netted total and reports 2.1%; level3Share divides by the three levels before netting, $1,008,800 million, and gives 2.0%. Goldman also reports Level 3 as 1.1% of total assets, and that one you can reproduce with a second call: /api/financials/balance-sheet, on the free plan, returns total assets of $1,809,320 million for the same year, and $20,324 million over that is 1.1%. None of these denominators is wrong. Pick one and apply it to every company you compare.
Level 3 assets by company: banks, insurers, alternative asset managers
Run the same call across a watchlist and the business model shows up in one number. These are the 13 filers we pulled, all for fiscal years ended December 31, 2025:
| Company | Business model | Level 3 | level3Share | Source 10-K (accession) |
|---|---|---|---|---|
| Blackstone Secured Lending Fund BXSL | Business development company | $14,100 million | 99.2% | 0001736035-26-000004 |
| Carlyle Group CG | Alternative asset manager | $11,479 million | 97.6% | 0001527166-26-000009 |
| Blue Owl Capital OWL | Alternative asset manager | $296 million | 82.7% | 0001823945-26-000009 |
| KKR & Co. KKR | Alternative asset manager | $114,643 million | 45.9% | 0001404912-26-000007 |
| Apollo Global Management APO | Alternative asset manager | $152,115 million | 41.9% | 0001858681-26-000013 |
| Blackstone BX | Alternative asset manager | $4,712 million | 39.6% | 0001193125-26-082531 |
| MetLife MET | Insurer | $38,527 million | 7.8% | 0001099219-26-000013 |
| American International Group AIG | Insurer | $3,924 million | 4.9% | 0000005272-26-000023 |
| Goldman Sachs GS | Bank | $20,324 million | 2.0% | 0000886982-26-000091 |
| Morgan Stanley MS | Bank | $8,039 million | 1.4% | 0000895421-26-000086 |
| Wells Fargo WFC | Bank | $7,027 million | 1.4% | 0000072971-26-000133 |
| JPMorgan Chase JPM | Bank | $25,107 million | 1.1% | 0001628280-26-008131 |
| Bank of America BAC | Bank | $9,948 million | 0.6% | 0000070858-26-000157 |
Banks sit between 0.6% and 2.0%. Their fair value books are huge (JPMorgan's three levels add up to $2.38 trillion), but they are dominated by trading assets and securities with observable prices. Most bank loans are carried at amortized cost, so they sit outside these recurring fair value tables.
Insurers sit in the middle: 7.8% at MetLife and 4.9% at AIG. Most of MetLife's $38.5 billion of Level 3 is in its available-for-sale debt securities: the same response's afsSecurities measure carries $33.9 billion of it.
Alternative asset managers and the BDC run from 39.6% to 99.2%. Blackstone Secured Lending Fund is a business development company, a private credit fund, and 99.2% of its $14.2 billion of investments is Level 3. For the managers, the ratio depends on what sits on the balance sheet, and the 10-K fair value notes show it. Apollo's note puts $147,957 million in Retirement Services, its Athene annuity business, against $4,158 million in Asset Management. KKR's puts $70,988 million in Asset Management and Strategic Holdings and $43,655 million in Insurance, its Global Atlantic business. Blackstone reports $4.7 billion of Level 3 on a much smaller fair value book of $11.9 billion, and Carlyle has the highest share of the managers, 97.6% of $11.8 billion.
None of this ranks risk. A bank's loan book needs judgment too (its credit loss allowance is an estimate), and an insurer's Level 3 bonds back long-dated policyholder liabilities. What the hierarchy tells you is how much of a balance sheet's fair value rests on observable prices and how much on a model, which is exactly the question to ask before you lean on a reported book value.
Tracking Level 3 assets over time, point-in-time
One number per company is a snapshot. The series is where the change shows. Here are two alternative asset managers against two banks, fiscal 2018 to 2025:
KKR's Level 3 assets grew from $21.8 billion to $114.6 billion over those eight balance dates. The step in 2021 is the year it began consolidating Global Atlantic, after completing the acquisition on February 1, 2021. Level 3 rose to $58.1 billion, yet the Level 3 share fell from 56.1% to 34.5%, because the insurer's portfolio arrived mostly in Level 2. The 2021 10-K (0001404912-22-000004) shows $73.5 billion of Level 2 in the Insurance segment against $13.3 billion of Level 3. Apollo went from $47.9 billion at the end of 2022 to $152.1 billion. Goldman Sachs moved the other way, $22.2 billion to $20.3 billion, and JPMorgan went from $17.2 billion to $25.1 billion.
Add period=quarter and the same call returns the table at every quarter end. The two managers diverged in 2026:
| Balance date | Apollo Level 3 | KKR Level 3 | dateFiled (APO / KKR) |
|---|---|---|---|
| December 31, 2025 | $152,115 million | $114,643 million | 2026-08-10 / 2026-08-06 |
| March 31, 2026 | $158,485 million | $119,097 million | 2026-05-07 / 2026-05-08 |
| June 30, 2026 | $166,861 million | $118,734 million | 2026-08-10 / 2026-08-06 |
Apollo added $14.7 billion of Level 3 in the first half of 2026. KKR's balance edged down between March 31 and June 30.
What dateFiled means for a backtest
Look at the December 31, 2025 row: its dateFiled is in August 2026. That is not a typo. The field is the filing date of the newest filing that reported the balance date, and each company's second-quarter 10-Q repeats the year-end column of the fair value table. The values are identical to the 10-K. The date is later.
The same rule is what carries restatements: when a later filing changes a balance, the endpoint serves the new figure and stamps it with the new filing's date. Apollo's Level 3 assets at December 31, 2022 were first reported as $47,450 million in the 10-K filed March 1, 2023 (accession 0001858681-23-000007). The next 10-K, filed February 27, 2024 (0001858681-24-000031), shows $47,931 million for the same date, and that is what the endpoint returns, with dateFiled 2024-02-27. Gate a backtest on dateFiled and a value never shows up before the filing it came from. The trade-off is a later date than strictly necessary: Apollo's 2025 table becomes visible on August 10, 2026, not on the February 25, 2026 10-K date. If your study needs the as-first-reported number, /api/filings lists each company's 10-K filings with their accession numbers, and our guide to point-in-time data for backtesting covers why the two dates matter. For point-in-time financial statements with an amendment trail on every fact, see the fundamentals API for quants.
A Level 3 screener in 30 lines of JavaScript
Wrap the call in a loop and you have a screener: it pulls the latest two fiscal years per company, reads the total-assets table, and reports the Level 3 balance, its share, and its one-year change. It also says so when a filer has no total-assets table, instead of printing a zero:
const BASE = 'https://api.stockfit.io/v1/api';
const headers = { Authorization: `Bearer ${process.env.STOCKFIT_API_KEY}` };

async function fairValueHierarchy(symbol) {
  const url = `${BASE}/footnotes/fair-value-hierarchy?symbol=${symbol}&period=annual&limit=2`;
  const res = await fetch(url, { headers });
  if (!res.ok) {
    throw new Error(`${res.status} for ${symbol}`);
  }
  return res.json(); // newest balance date first
}

const pct = x => `${(x * 100).toFixed(1)}%`;

for (const symbol of ['APO', 'KKR', 'MET', 'GS', 'JPM', 'ARCC']) {
  const [latest, prior] = await fairValueHierarchy(symbol);
  const now = latest?.measures.find(m => m.measure === 'assets');
  if (!now) {
    const served = latest ? latest.measures.map(m => m.measure).join(', ') : 'nothing';
    console.log(symbol.padEnd(5), `no total-assets table (served: ${served})`);
    continue;
  }
  const before = prior?.measures.find(m => m.measure === 'assets');
  const growth = before?.level3 ? pct(now.level3 / before.level3 - 1) : 'n/a';
  console.log(
    symbol.padEnd(5),
    latest.period,
    `L3 $${(now.level3 / 1e9).toFixed(1)}B`.padEnd(12),
    `share ${pct(now.level3Share)}`.padEnd(12),
    `L3 1y ${growth.padStart(6)}`,
    ` dateFiled ${latest.dateFiled}`,
  );
}
Run against the live API, it prints:
APO   2025-12-31 L3 $152.1B   share 41.9%  L3 1y  41.2%  dateFiled 2026-08-10
KKR   2025-12-31 L3 $114.6B   share 45.9%  L3 1y  40.9%  dateFiled 2026-08-06
MET   2025-12-31 L3 $38.5B    share 7.8%   L3 1y  -1.3%  dateFiled 2026-08-06
GS    2025-12-31 L3 $20.3B    share 2.0%   L3 1y  -0.2%  dateFiled 2026-08-03
JPM   2025-12-31 L3 $25.1B    share 1.1%   L3 1y   5.6%  dateFiled 2026-08-06
ARCC  no total-assets table (served: cashEquivalents)
Apollo's and KKR's Level 3 balances each grew about 41% in 2025, while MetLife's and Goldman's were close to flat. The last line is the important one. Ares Capital, a BDC, reports $28.7 billion of Level 3 investments out of $29.5 billion in its 2025 10-K (0001287750-26-000006), but it tags them on us-gaap:InvestmentOwnedAtFairValue, the schedule-of-investments concept, which this endpoint does not map to a measure. The screener says so instead of printing a zero, which is the behavior you want before you rank anything.
/api/footnotes/fair-value-hierarchy is on the Professional plan ($99/mo, $69/mo billed annually) with the rest of the footnotes family. to start with the balance sheet endpoint, which is on every plan.
What the fair value hierarchy does not tell you
- Recurring measurements only. Assets remeasured at fair value only after an impairment are a separate, nonrecurring disclosure and are not in these tables.
- No asset-class or segment split. The endpoint returns each table's totals by level. Which bonds, loans, or equity stakes make up Level 3, and the segment splits quoted above, stay in the filing. Pension plan assets are the exception: /api/footnotes/retirement-plans returns them by category and fair value level, as our post on the pension funded status API shows.
- Measures follow the filer's tagging. Blackstone Secured Lending Fund tags no total-assets table, so it is compared on
investments, and Ares Capital's schedule of investments is not served at all. Check which measures came back before you compare two companies. - Denominators differ. Netting, NAV, and filer extension members mean
level3Sharecan differ from the ratio a company prints, as with Goldman's 2.0% against 2.1%. The gap can be large: Bank of America's three levels sum to $1.75 trillion against a $1.01 trillion total after netting, so the same $9.9 billion of Level 3 is 0.6% of one and 1.0% of the other. - A high Level 3 share is not a verdict. It says how prices are measured. The filing's Level 3 roll-forward and unobservable input ranges are where to look next; a filing found by accession through /api/filings/search-by-accession-number is one click from EDGAR.
StockFit provides data, not investment advice. Nothing here is a recommendation to buy or sell any security.
FAQ
Q.What are Level 3 assets?
Q.What is the difference between Level 1, Level 2, and Level 3 assets?
Q.How do I find a company's Level 3 assets in a 10-K?
/api/footnotes/fair-value-hierarchy returns the Level 1, 2, and 3 totals per table for each balance date.Q.Can I get Level 3 assets from the SEC EDGAR XBRL API?
FairValueByFairValueHierarchyLevelAxis dimension. For Goldman Sachs the companyconcept response holds the $963,966 million total for December 31, 2025 and no Level 3 figure. You either parse each filing's XBRL instance or use an API that has done it.Q.Which companies have the most Level 3 assets?
Q.Why do alternative asset managers report so many Level 3 assets?
Q.Is a high Level 3 share a red flag?
Q.Is there an API for fair value hierarchy data?
/api/footnotes/fair-value-hierarchy returns Level 1, Level 2, Level 3, and NAV amounts for each measure a company tags (total assets and liabilities at fair value, investments, available-for-sale and held-to-maturity securities, cash equivalents, derivatives), with a derived level3Share and the filing date. It is on the Professional plan ($99/mo, $69/mo billed annually).Ready to build?
Free API key, no credit card.