Best Data Center ETFs 2026: What Each One Holds
Best data center ETFs for 2026 compared by SEC N-PORT holdings: data center REIT ETFs vs AI infrastructure and power ETFs, overlap, fees, and returns.
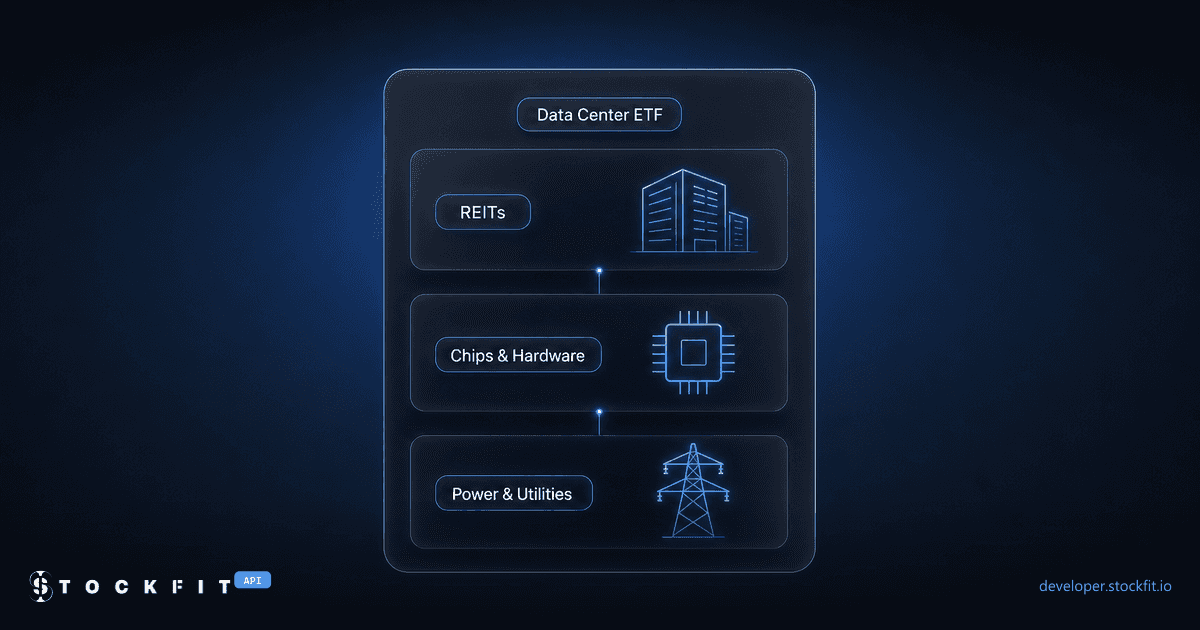
Every serious conversation about AI eventually turns physical: concrete, chips, copper, and electricity. The models are software, but much of the money behind them goes into buildings full of servers and the power that runs them. So when I went looking for the best data center ETFs of 2026, the first question was not which fund ranks highest. It was which part of that build-out each fund actually owns.
The roundups that rank for this search list an expense ratio, assets under management, and a recent return, and a few quote a fund's real estate share. None that we found compares these seven funds side by side, splits each one into data center REITs, towers, chips, hardware, power equipment, and utilities with an as-of date, or measures how much the funds overlap. That split decides what you actually own.
So we built it from SEC filings with the StockFit API. /api/fund/holdings returned every position in each fund's latest N-PORT report, /api/company/details tagged each company with its industry, and fee tables, fund flows, and prices came from three more endpoints. Every fund figure below is a field from those responses or from the SEC filing named next to it, captured on October 14, 2026. It is data, not investment advice.
Who gets paid in the AI data center boom
A data center is a building, a lease, racks of servers, a network, and a very large power bill. Each of those is a different business, and the public companies behind them fall into six layers. We used these layers to classify every holding before looking at how any fund markets itself:
Own the buildings and lease space, power, and cooling to cloud providers and enterprises. Examples held by these funds: Equinix, Digital Realty, Applied Digital, NEXTDC.
Lease antenna space on cell towers and capacity on fiber routes. Digital infrastructure, but not data centers. Examples held by these funds: American Tower, Crown Castle, SBA Communications, Uniti.
The processors, accelerators, and memory inside every server. Examples held by these funds: Nvidia, Broadcom, AMD, Micron, SK hynix.
The servers, the storage, and the network gear that connects them. Examples held by these funds: Dell, Super Micro Computer, Seagate, Western Digital, Arista, Ciena.
Switchgear, cooling, turbines, and the contractors that build grid connections. Examples held by these funds: Vertiv, Eaton, GE Vernova, Quanta Services.
The electricity itself, and the fuel behind it. Examples held by these funds: Constellation Energy, NextEra Energy, Vistra, Cameco.
The power layer is not a footnote. Lawrence Berkeley National Laboratory's 2024 report on US data center energy use found that data centers consumed about 4.4% of total US electricity in 2023 and expects them to use between 6.7% and 12% by 2028, from 176 TWh to 325 to 580 TWh. The buildings also show up in the cloud providers' own filings, as the data center lease commitments they have signed but not yet started.
The landlord case for the AI data center boom covers the first two layers; the picks-and-shovels case covers the other four. A fund labeled “data center” can hold any mix of them. The same holdings-first approach graded the best AI ETFs of 2026, and the result there was the same: the label tells you little until you read the portfolio.
How we compared seven data center ETFs
We started with the four funds that sell themselves as data center plays (DTCR, SRVR, IDGT, RACK), added the two AI infrastructure funds that hold data center operators and their suppliers (TCAI, AIPO), and included POWR as the pure power play. All seven file N-PORT reports with the SEC, which is where every weight below comes from.
Step 1: every holding, from the N-PORT report
/api/fund/holdings returns one row per position from a fund's latest N-PORT report, sorted by weight, with the CUSIP and ISIN, the value, the percent of net assets, and the issuer's CIK and ticker where one exists. Two of DTCR's 32 rows:
curl "https://api.stockfit.io/v1/api/fund/holdings?symbol=DTCR&pageSize=1000" \
-H "Authorization: Bearer $STOCKFIT_API_KEY"{
"page": 1,
"pageSize": 1000,
"totalPages": 1,
"totalResults": 32,
"reportDate": "2026-05-31",
"data": [
{
"name": "EQUINIX, INC.",
"cusip": "29444U700",
"isin": "US29444U7000",
"ticker": "EQIX",
"title": "EQUINIX INC REIT",
"valueUsd": 261888748.2,
"pctVal": 12.21379727382,
"balance": 245205,
"units": "NS",
"assetCat": "EC",
"issuerCat": "OTHER",
"country": "US",
"payoffProfile": "Long",
"fairValueLevel": 1,
"mappedCik": 1101239,
"mappedSymbol": "EQIX",
"reportDate": "2026-05-31"
},
{
"name": "NEXTDC LIMITED",
"isin": "AU000000NXT8",
"title": "NEXTDC LTD COMMON STOCK",
"valueUsd": 113591636.3,
"pctVal": 5.297612926505,
"balance": 10359274,
"units": "NS",
"assetCat": "EC",
"issuerCat": "OTHER",
"country": "AU",
"payoffProfile": "Long",
"fairValueLevel": 1,
"reportDate": "2026-05-31"
}
]
}The second row is why the ISIN matters. NEXTDC is listed in Sydney and does not file with the SEC, so this filing gives it no CUSIP, and there is no CIK to map it to. Several of DTCR's holdings look like this.
Step 2: an industry for every company
For each mapped CIK, /api/company/details returns StockFit's SFIC industry, which is finer than the SIC code next to it. Trimmed to the classification fields:
curl "https://api.stockfit.io/v1/api/company/details?cik=1101239" \
-H "Authorization: Bearer $STOCKFIT_API_KEY"{
"name": "EQUINIX INC",
"cik": 1101239,
"sic": "6798",
"sector": "Real Estate",
"industry": "Data Center REITs"
}The seven funds' holdings span 56 SFIC industries, which we grouped into the six layers above plus Other. Holdings without an SEC registrant (NEXTDC, Keppel DC REIT, SK hynix, Cellnex, and others) were classified by name, and every mapped company name was checked against the holding's own name before its industry was used. Cash, repo, and securities-lending collateral are excluded, so each layer is a share of net assets: SRVR and IDGT report collateral and cash worth 8.2% and 12.5% of net assets as holdings, which would otherwise push their totals past 100%.
Step 3: fees, flows, and prices
/api/fund/fees returns each fund's fee table from its N-1A prospectus filings with the accession number, /api/fund/profile returns net assets plus monthly sales and redemptions from each N-PORT report, and /api/price/history returns dividend-adjusted daily closes for the returns.
Data center ETF holdings: REITs, chips, or power
Sorted from the most real estate to the least, the seven funds run from landlords to power plants:
SRVR is the closest thing to a pure data center REIT ETF: 77.8% of its net assets sit in data center, tower, and fiber REITs and operators. POWR holds none; it is 59.2% utilities, nuclear, and fuel and 40.3% power equipment.
Towers are the hidden ingredient in the REIT-heavy funds. 25.6% of DTCR, 32.8% of SRVR, and 24.8% of IDGT sit in tower and fiber REITs such as American Tower and Crown Castle. That is digital infrastructure, but it leases antenna space, not server halls.
After the landlords, the funds diverge. DTCR adds 27.9% in chips and memory (SK hynix, Micron, Marvell, Intel, AMD). IDGT puts 40.8% into servers, storage, and networking gear (Extreme Networks, Arista, Cisco, Ciena, Nokia). RACK holds between 19.4% and 24.5% in each of four layers. AIPO is 54.0% power and cooling equipment. TCAI holds 11.8% in companies SFIC classifies as crypto mining and digital infrastructure (IREN, TeraWulf, Cipher Digital, Core Scientific, Hut 8), part of the gray Other segment in its bar.
How current are these holdings?
N-PORT reports become public quarterly. Each fund's latest report was filed 55 to 60 days after its report date, so by mid-October the oldest snapshots here, from May 31, 2026, are four and a half months old. All seven funds also publish a daily holdings file, which /api/fund/holdings/daily serves on the ETF and Pro plans. The same classification run on the October 12 to 14 files:
| Fund | Largest layer, N-PORT | Largest layer, daily file | Biggest single-layer move |
|---|---|---|---|
| SRVR | Data center REITs and operators 45.0%, Jul 31, 2026 | Data center REITs and operators 42.2%, Oct 13, 2026 | Tower and fiber REITs +2.9 pts |
| DTCR | Data center REITs and operators 43.9%, May 31, 2026 | Data center REITs and operators 43.4%, Oct 12, 2026 | Chips and memory -9.1 pts |
| IDGT | Servers, storage, networking 40.8%, Jun 30, 2026 | Servers, storage, networking 42.6%, Oct 12, 2026 | Data center REITs and operators -4.8 pts |
| RACK | Servers, storage, networking 24.5%, Jun 30, 2026 | Chips and memory 28.0%, Oct 12, 2026 | Chips and memory +4.6 pts |
| AIPO | Power and cooling equipment 54.0%, May 31, 2026 | Power and cooling equipment 53.5%, Oct 14, 2026 | Other +4.4 pts |
| TCAI | Servers, storage, networking 31.6%, May 31, 2026 | Power and cooling equipment 35.8%, Oct 13, 2026 | Power and cooling equipment +9.2 pts |
| POWR | Utilities, nuclear, fuel 59.2%, Jun 30, 2026 | Utilities, nuclear, fuel 62.0%, Oct 12, 2026 | Utilities, nuclear, fuel +2.7 pts |
For five of the seven funds, no layer moved by 5 points or more. Two moved further. In DTCR, chips and memory fell from 27.9% to 18.8% and towers rose from 25.6% to 31.8%. In TCAI, power and cooling equipment rose from 26.6% to 35.8%, now its largest layer. The quarterly filing stays the audit trail; the daily file shows where a fast-moving fund sits today, as our look at how often ETF holdings change explains.
Best data center ETFs 2026, fund by fund
The best data center ETF depends on which layer you want to own. Here is each fund from its latest filings, in the same order as the chart:
| Fund | Net assets | Holdings | Top 10 | Expense ratio | YTD 2026 | Largest layer |
|---|---|---|---|---|---|---|
| SRVR | $370.7M | 65 | 71.9% | 0.49% | +0.6% | Data center REITs and operators 45.0% |
| DTCR | $2.14B | 25 | 66.2% | 0.50% | +25.1% | Data center REITs and operators 43.9% |
| IDGT | $502.8M | 25 | 60.1% | 0.37% | +31.2% | Servers, storage, networking 40.8% |
| RACK | $31.2M | 50 | 43.1% | 0.50% | n/a | Servers, storage, networking 24.5% |
| AIPO | $750.9M | 75 | 51.5% | 0.69% | +21.0% | Power and cooling equipment 54.0% |
| TCAI | $216.9M | 43 | 50.4% | 0.65% | +42.9% | Servers, storage, networking 31.6% |
| POWR | $419.5M | 68 | 47.3% | 0.39% | +7.7% | Utilities, nuclear, fuel 59.2% |
Net assets, holdings, and weights from each fund's latest N-PORT report; YTD is the total return from the December 31, 2025 close to Oct 14, 2026 (RACK launched in June 2026).
Tracks the Solactive GPR Data & Infrastructure Real Estate Index. Since a December 2025 methodology update, the index targets 80% data and infrastructure real estate and 20% power generation companies.
Top holdings: Digital Realty 16.7%, Equinix 15.7%, American Tower 15.1%. Expense ratio 0.49%.
Closest fit: The purest landlord exposure of the seven: data center and tower REITs, with a small power sleeve.
Renamed from the Global X Data Center REITs & Digital Infrastructure ETF (VPN) on April 1, 2024. Tracks the Solactive Data Center REITs & Digital Infrastructure Index: data center owners, cell tower owners, and hardware makers.
Top holdings: Equinix 12.2%, Digital Realty 10.9%, American Tower 9.6%. Expense ratio 0.50%.
Closest fit: Landlords plus a chip and memory sleeve, including listings outside the US.
Tracks the S&P Data Center, Tower REIT and Communications Equipment Index. The lowest expense ratio of the seven.
Top holdings: Equinix 8.7%, Digital Realty 8.3%, American Tower 7.7%. Expense ratio 0.37%.
Closest fit: Landlords plus networking and storage hardware.
Tracks the MarketVector Data Center Supply Chain Index. Launched in June 2026, it is the newest and smallest fund here, with one N-PORT report so far.
Top holdings: Micron 5.3%, Amphenol 4.8%, Sandisk 4.6%. Expense ratio 0.50%.
Closest fit: The supply chain in one basket: chips, hardware, power equipment, and nuclear and utilities in similar weights.
Tracks the MarketVector US Listed AI and Power Infrastructure Index. The highest expense ratio of the seven.
Top holdings: Quanta Services 7.9%, Vertiv 7.2%, GE Vernova 7.2%. Expense ratio 0.69%.
Closest fit: The equipment that powers and cools data centers, plus the utilities that supply them.
Actively managed: its prospectus says it “does not seek to track the performance of an index.” It invests in AI-capable data center, technology infrastructure, and energy infrastructure companies.
Top holdings: Dell Technologies 8.9%, Micron 7.6%, Seagate 5.8%. Expense ratio 0.65%.
Closest fit: Servers, storage, and power, plus a stake in crypto miners.
Was the iShares MSCI Global Energy Producers ETF (FILL) until October 29, 2025, when it switched to the S&P U.S. Power Infrastructure Select Index.
Top holdings: GE Vernova 7.6%, Eaton 6.4%, Quanta Services 6.2%. Expense ratio 0.39%.
Closest fit: The electricity side of the trade, with no data center REITs at all.
None of this is a recommendation. A fund that matches the layer you want can still be wrong for your portfolio, and every number here is a snapshot with a date on it.
DTCR vs SRVR vs IDGT: the same six REITs
The three real-estate-heavy funds share a core: Equinix, Digital Realty, American Tower, Crown Castle, SBA Communications, and Uniti appear in all three. Together those six names are 46.7% of DTCR, 56.7% of SRVR, and 41.8% of IDGT.
| SRVR | DTCR | IDGT | RACK | AIPO | TCAI | POWR | |
|---|---|---|---|---|---|---|---|
| SRVR | · | 50 | 34 | 7 | 8 | 2 | 1 |
| DTCR | 50 | · | 39 | 16 | 10 | 5 | 0 |
| IDGT | 34 | 39 | · | 8 | 1 | 9 | 0 |
| RACK | 7 | 16 | 8 | · | 39 | 34 | 13 |
| AIPO | 8 | 10 | 1 | 39 | · | 24 | 39 |
| TCAI | 2 | 5 | 9 | 34 | 24 | · | 18 |
| POWR | 1 | 0 | 0 | 13 | 39 | 18 | · |
DTCR and SRVR share 12 holdings, and 49.8% of the two portfolios is identical by weight. Holding both mostly doubles down on the same landlords. The other cluster sits in the bottom right of the matrix: RACK and AIPO share 24 names (39.4% identical), AIPO and POWR share 22 (39.3%), and RACK and TCAI share 18 (34.2%). DTCR and IDGT have no holdings in common with POWR at all.
/api/fund/overlap runs this comparison for any two funds in one call. It matches holdings on CUSIP, so for pairs that include foreign listings filed without one, such as NEXTDC or Keppel DC REIT, we matched on ISIN from /api/fund/holdings instead.
AI power infrastructure ETFs vs data center REIT ETFs
The difference between a data center ETF and an AI infrastructure ETF is mostly where the electricity sits. Power equipment plus utilities is zero in DTCR and IDGT and 16.5% of SRVR, against 39.8% of TCAI, 40.0% of RACK, 74.7% of AIPO, and 99.6% of POWR.
Even the most landlord-heavy fund is leaning toward power. SRVR's summary prospectus dated December 15, 2025 says the index “updated its methodology in December 2025 expanding its investment universe to include companies from both developed and emerging market countries that are involved in small modular reactors, nuclear power, power infrastructure and energy systems, or digital infrastructure and connectivity systems.” The index now targets 80% data and infrastructure real estate and 20% power generation companies drawn from the Solactive Small Modular Reactor Index, and SRVR's July 31 report shows turbine and reactor makers such as Doosan Enerbility and Mitsubishi Heavy Industries, uranium miners such as Cameco, and small modular reactor developers such as NuScale and Oklo next to its REITs.
On the AI side, the fund types blur. TCAI's prospectus defines AI infrastructure companies as “(i) AI-capable data centers, (ii) technology infrastructure companies that provide AI-essential infrastructure to AI-capable data centers, and (iii) energy infrastructure companies that provide AI-essential infrastructure to AI-capable data centers.” In practice, data center REITs and operators are 1.6% of the fund; servers, storage, and power make up most of it. If what you want is the electricity itself, AIPO and POWR are the two funds built around it, AIPO on the equipment side and POWR on the utilities side.
Data center ETF expense ratios and fund flows
Expense ratios come from each fund's N-1A fee table, the legal disclosure, not a fact sheet:
| Fund | Expense ratio | Filed | Accession |
|---|---|---|---|
| IDGT | 0.37% | 2026-07-27 | 0001193125-26-318131 |
| POWR | 0.39% | 2026-07-27 | 0001193125-26-318139 |
| SRVR | 0.49% | 2026-08-27 | 0000894189-26-024046 |
| DTCR | 0.50% | 2026-03-28 | 0001432353-26-000311 |
| RACK | 0.50% | 2026-05-29 | 0001137360-26-000574 |
| TCAI | 0.65% | 2026-04-02 | 0001213900-26-036353 |
| AIPO | 0.69% | 2025-12-23 | 0001999371-25-021156 (497K) |
DTCR's row from /api/fund/fees, trimmed:
{
  "filedDate": "2026-03-28",
  "accessionNumber": "0001432353-26-000311",
  "symbol": "DTCR",
  "managementFee": 0.005,
  "otherExpenses": 0,
  "totalExpenseRatio": 0.005,
  "feeWaiver": null
}
Two funds cut fees recently. IDGT went from 0.41% in its July 2024 filing to 0.39% in 2025 and 0.37% in 2026. SRVR's fee table showed 0.60% with a 0.05% waiver (0.55% net) in October 2024 and 0.49% from August 2025. AIPO's figure comes straight from its December 23, 2025 summary prospectus on EDGAR, because /api/fund/fees returned no fee rows for AIPO when we pulled this data.
Money followed the hardware and power side. Net creations, N-PORT sales minus redemptions, over each fund's latest reported quarters:
DTCR took in $1,309 million over the four quarters to May 31, 2026, and its net assets grew from $245 million to $2.14 billion over that year. IDGT added $298 million in the quarter to June 30, 2026 alone, which helped lift its net assets from $166 million to $503 million. SRVR, the most landlord-heavy fund, is the only one with net outflows: $58 million over its four quarters to July 31, 2026. Our guide to ETF fund flows from N-PORT covers how these figures are built.
Data center ETF performance in 2026
| Fund | YTD 2026 | Since June 2, 2026 | Chips + hardware |
|---|---|---|---|
| POWR | +7.7% | -9.3% | 0.0% |
| RACK | n/a | -13.8% | 48.0% |
| IDGT | +31.2% | -16.1% | 49.2% |
| SRVR | +0.6% | -17.5% | 0.0% |
| DTCR | +25.1% | -18.6% | 30.4% |
| AIPO | +21.0% | -21.3% | 14.4% |
| TCAI | +42.9% | -24.8% | 46.5% |
Total return from dividend-adjusted closes through Oct 14, 2026. RACK has no 2026 starting price; its first close was Jun 2, 2026.
Through October 14, 2026, the four funds with chip or hardware holdings lead the year and the two without trail: TCAI +42.9%, IDGT +31.2%, DTCR +25.1%, AIPO +21.0%, POWR +7.7%, SRVR +0.6%. All seven have fallen since early June, from -9.3% (POWR) to -24.8% (TCAI); RACK is -13.8% from its first close on June 2, 2026. Six funds over nine and a half months is an observation, not a pattern to trade on, and past returns say nothing about the next nine months.
Pull data center ETF holdings with the API
The classification above takes one short script. It pulls a fund's latest N-PORT holdings, looks up the SFIC industry for every mapped company, and sums the weights:
const BASE = 'https://api.stockfit.io/v1/api';
const headers = { Authorization: `Bearer ${process.env.STOCKFIT_API_KEY}` };

async function get(path) {
  const res = await fetch(`${BASE}${path}`, { headers });
  if (!res.ok) throw new Error(`${res.status} on ${path}`);
  return res.json();
}

const symbol = process.argv[2] ?? 'DTCR';
const { reportDate, data } = await get(`/fund/holdings?symbol=${symbol}&pageSize=1000`);

const industryByCik = new Map();
const weightByIndustry = {};
for (const h of data) {
  if (h.assetCat !== 'EC') continue; // equities only: skips repo, cash, and lending collateral
  let industry = 'No SEC registrant (classify by name)';
  if (h.mappedCik) {
    if (!industryByCik.has(h.mappedCik)) {
      const company = await get(`/company/details?cik=${h.mappedCik}`);
      industryByCik.set(h.mappedCik, company.industry);
    }
    industry = industryByCik.get(h.mappedCik);
  }
  weightByIndustry[industry] = (weightByIndustry[industry] ?? 0) + h.pctVal;
}

console.log(`${symbol}, N-PORT report date ${reportDate}`);
for (const [industry, weight] of Object.entries(weightByIndustry).sort((a, b) => b[1] - a[1])) {
  console.log(`${weight.toFixed(1).padStart(5)}%  ${industry}`);
}
Saved as an .mjs file and run with Node 18 or newer against DTCR on October 14, 2026, it prints:
DTCR, N-PORT report date 2026-05-31
 23.6%  Tower & Digital Infrastructure REITs
 23.1%  Data Center REITs
 14.7%  Processors, Logic & Digital ICs
 14.4%  No SEC registrant (classify by name)
 10.5%  Cloud & Data Center Infrastructure
  4.4%  Memory & Storage Semiconductors
  2.6%  Other / Unclassified
  2.5%  Servers & Enterprise Systems
  2.1%  Semiconductors
  1.9%  Analog, Mixed-Signal & Microcontrollers
The 14.4% with no SEC registrant is NEXTDC, SK hynix, Keppel DC REIT, and Macquarie Technology, the foreign listings you classify by name. Change the symbol to profile any fund, or point the same loop at /api/fund/holdings/daily for the latest daily file. To find every fund that holds one stock, the reverse ETF lookup walkthrough covers /api/fund/reverse-lookup, and the ETF data API lists all 22 fund endpoints, from fees and flows to overlap. A covers /api/fund/profile, /api/company/details, and /api/price/history; holdings are on the Starter, ETF, and Pro plans. Every N-PORT and prospectus cited here is also on SEC EDGAR by its accession number.
FAQ
Q.What is a data center ETF?
Q.What is the best data center ETF in 2026?
Q.Is there an ETF for data center REITs?
Q.How much do DTCR and SRVR overlap?
Q.Is there a data center power ETF?
Q.Are data center ETFs the same as technology ETFs?
Q.What is the difference between a data center ETF and an AI infrastructure ETF?
Q.How can I get data center ETF holdings through an API?
Q.How current is N-PORT holdings data?
Ready to build?
Free API key, no credit card.