How to Find All ETFs That Hold a Specific Stock
Find all ETFs that hold a specific stock with one reverse lookup API call: ETF stock exposure from SEC N-PORT holdings as JSON, weights included.
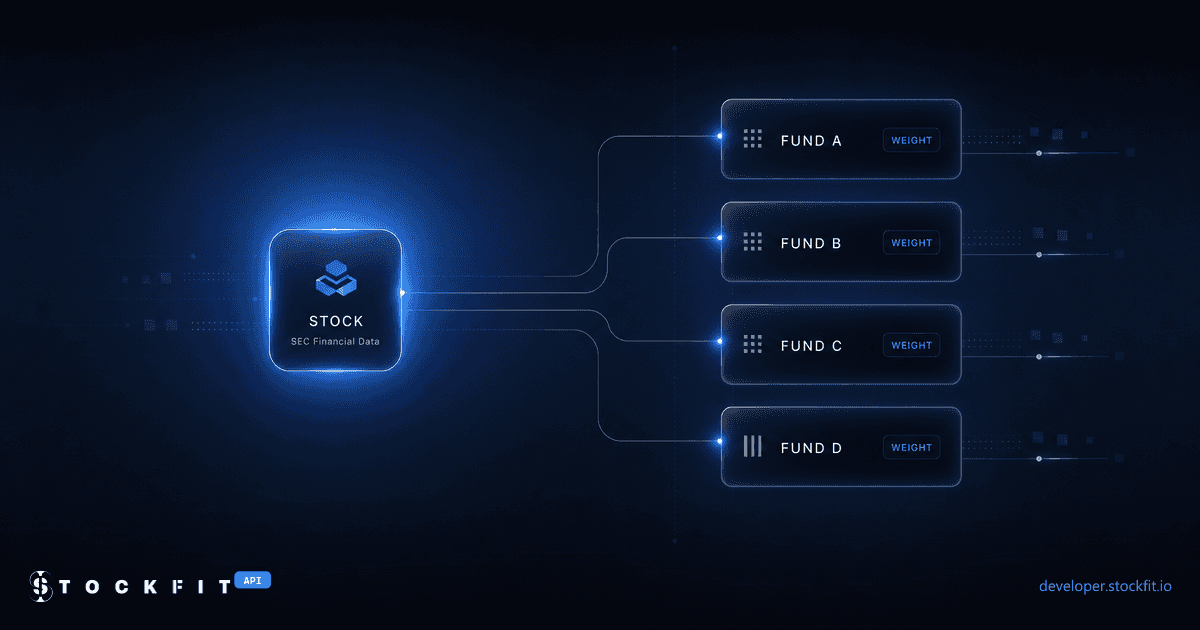
There are plenty of web tools that let you find all ETFs that hold a specific stock: you paste a ticker symbol into a search box and read the table. That works exactly once. The moment you want the same answer inside a screener, a risk check, a rebalancing script, or an AI agent, a search box is useless. You need the same lookup as an API call that returns JSON.
This guide does the lookup programmatically with the StockFit ETF reverse lookup API: one call per stock, every ETF and mutual fund holding it, with portfolio weight, shares held, and market value on every row, sourced from SEC N-PORT filings. All responses below are real API output pulled on July 24, 2026. Holdings data keeps moving, so the exact figures will have shifted by the time you run this, and that is rather the point: your call returns the current answer.
Why ETF stock exposure is worth querying
“Which funds hold this stock?” is one of the most natural questions in equity research, and people ask it company by company: exposure searches spike whenever a single name gets hot. A few reasons the reverse direction of ETF holdings matters:
- Passive flow passthrough. A stock held by thousands of index funds mechanically receives a slice of every dollar flowing into them. Knowing how much of a company sits inside ETFs tells you how index-driven its demand is.
- Crowding and concentration. If a mid-cap is a significant holding in dozens of thematic ETFs, a rotation out of the theme hits the stock from every one of them at once. We count this among the alternative data signals hiding in SEC filings.
- Vehicle selection. An investor who wants exposure to a stock through a fund needs the list of candidate ETFs, ranked by how much of the stock each one actually carries.
- Ownership context. The fund side complements 13F institutional data: N-PORT tells you which specific funds, not just which managers, own the name.
The stock exposure web tools, and why you cannot build on them
Search for this topic and the entire first page of results is interactive web tools: enter a ticker symbol, get a table of ETFs with significant holdings in that stock. They are fine for a one-off look. For a developer they all share the same dead ends:
- No API. The output is a rendered HTML table. Automating it means scraping a page that can change layout any day, usually against the site's terms.
- No provenance. The tables rarely say which filing or file date a number came from, so you cannot verify a weight or reconcile it later.
- Partial coverage. Most tools cover US equity ETFs only. The disclosure regime behind the data, SEC Form N-PORT, actually covers registered mutual funds too, including fund-of-funds structures.
The data itself is public. Every registered fund reports its complete portfolio holdings on Form N-PORT, position by position. The work is parsing tens of thousands of XML filings, resolving every holding's identifier back to the right company, and indexing the result so the reverse question (given a stock, list the funds holding it) is one query. That is what the reverse lookup endpoint precomputes.
The ETF reverse lookup API: one call, every fund holding the stock
The endpoint is /api/fund/reverse-lookup. Give it a ticker symbol (or a CIK, CUSIP, or FIGI) and it returns the paginated list of ETFs and mutual funds that hold the stock, sorted by the market value of the position, largest first. With cURL:
curl "https://api.stockfit.io/v1/api/fund/reverse-lookup?symbol=NVDA&pageSize=10" \
  -H "Authorization: Bearer YOUR_API_KEY"
Or with the official Node.js SDK, @stockfit/api:
// npm i @stockfit/api
import {createClient, fundReverseLookup} from '@stockfit/api';

createClient({token: process.env.STOCKFIT_TOKEN});

const {data, error} = await fundReverseLookup({query: {symbol: 'NVDA', pageSize: 10}});
if (error) {
  throw new Error(`API error: ${JSON.stringify(error)}`);
}

console.log(`${data.totalResults} funds hold NVDA`);
for (const fund of data.data) {
  console.log(`${fund.fundTicker ?? fund.fundName}  ${fund.pctVal.toFixed(2)}%  $${(fund.valueUsd / 1e9).toFixed(2)}B`);
}
As of the July 24, 2026 pull, NVIDIA is held by 2,215 funds. The response, trimmed to the first rows:
{
  "page": 1,
  "pageSize": 10,
  "totalPages": 222,
  "totalResults": 2215,
  "data": [
    {
      "fundName": "Vanguard Total Stock Market Index Fund",
      "fundTicker": "VTI",
      "fundCik": 36405,
      "fundSeriesId": 2848,
      "valueUsd": 127849303728,
      "pctVal": 6.419132792125,
      "balance": 733080870,
      "reportDate": "2026-03-31",
      "fundNetAssets": 1991691212321
    },
    {
      "fundName": "iShares Core S&P 500 ETF",
      "fundTicker": "IVV",
      "fundCik": 1100663,
      "fundSeriesId": 4310,
      "valueUsd": 54504654387.2,
      "pctVal": 7.564382338558,
      "balance": 312526688,
      "reportDate": "2026-03-31",
      "fundNetAssets": 720543356321
    },
    {
      "fundName": "SPDR S&P 500 ETF TRUST",
      "fundTicker": "SPY",
      "fundCik": 884394,
      "fundSeriesId": 0,
      "valueUsd": 49374840753.6,
      "pctVal": 7.577613507003,
      "balance": 283112619,
      "reportDate": "2026-03-31",
      "fundNetAssets": 651588269948
    }
  ]
}
A detail worth pausing on, because it is the kind of receipt this data should produce: the three big S&P 500 trackers in the full top ten (VOO at 7.577%, IVV at 7.564%, SPY at 7.578%) report NVIDIA's portfolio weight within 1.4 basis points of each other, from three independent filers. When three funds tracking the same index disclose the same weight through separate N-PORT filings, the parsing pipeline is doing its job. Each row traces to a specific filing by the fund identified by fundCik and fundSeriesId, so any number here can be checked against the source document on EDGAR.
Query by CUSIP, FIGI, or CIK
The ticker symbol is one of five accepted selectors; the endpoint takes exactly one of symbol, cik, cusip, composite_figi, or share_class_figi. That matters when your pipeline is not keyed on tickers: 13F institutional filings identify positions by CUSIP, and OpenFIGI-based systems carry FIGIs. All of these resolve to the same NVIDIA entity and return the identical fund list:
curl "https://api.stockfit.io/v1/api/fund/reverse-lookup?cusip=67066G104" \
  -H "Authorization: Bearer YOUR_API_KEY"

curl "https://api.stockfit.io/v1/api/fund/reverse-lookup?composite_figi=BBG000BBJQV0" \
  -H "Authorization: Bearer YOUR_API_KEY"
Walking the full list
The response is paginated with pageSize up to 1,000, so the complete list of funds holding a mega-cap is three requests. The loop:
const all = [];
let page = 1;
let totalPages = 1;
while (page <= totalPages) {
  const {data} = await fundReverseLookup({query: {symbol: 'NVDA', page, pageSize: 1000}});
  all.push(...data.data);
  totalPages = data.totalPages;
  page++;
}

const totalValue = all.reduce((sum, f) => sum + f.valueUsd, 0);
console.log(`${all.length} funds, $${(totalValue / 1e12).toFixed(2)}T of NVDA held across all of them`);2215 funds, $1.20T of NVDA held across all of themThat aggregate is a statement you cannot get from a web tool: as of the latest filings, registered funds together report $1.20 trillion of NVIDIA on their books, and every dollar of it traces to a filed portfolio report.
Reading the response: portfolio weight, shares held, market value
Each row carries three measures of the position, and they answer different questions:
valueUsdis the market value of the position. It is the sort key, and it tells you where the dollars are: Vanguard Total Stock Market alone carries $127.8B of NVIDIA.pctValis the portfolio weight, the position as a percent of the fund's net assets. It tells you how concentrated the fund is in the stock: the tech-only Vanguard Information Technology fund (VGT) holds a 17.27% NVIDIA weight, more than double the S&P 500 funds, on a fraction of their assets.balanceis shares held. Multiply by price to sanity-checkvalueUsd, or track it across quarters to see funds accumulating or trimming.
reportDate is the as-of date of the fund's newest N-PORT holdings report, and it is per fund: in the NVIDIA pull most funds report as of 2026-03-31 while Fidelity and American Funds rows carry 2026-02-28, because filing cycles differ. Public N-PORT data is quarterly with a lag, so a position can be one to four months old. That cadence is fine for exposure and crowding work; when you need yesterday's portfolio for a supported ETF, pair this endpoint with the daily ETF holdings API, which serves issuer-published files through /api/fund/holdings/daily.
One honest wrinkle: a few rows, like Fidelity's 500 Index Fund or Growth Fund of America, have fundTicker: null. Those are mutual funds whose share classes carry no ticker in the SEC's structured data (a single mutual fund series can have half a dozen class tickers, or none in the filings at all). The fund is still fully identified by fundCik plus fundSeriesId, and we return the null rather than guessing a symbol. ETFs and single-listing trusts resolve to their real ticker.
From one lookup to a watchlist exposure screen
Because the answer is JSON, the one-off lookup generalizes to a screen in a few lines. This loops a watchlist and reports how many funds hold each name and where the largest position sits:
import {createClient, fundReverseLookup} from '@stockfit/api';

createClient({token: process.env.STOCKFIT_TOKEN});

const watchlist = ['NVDA', 'AAPL', 'MU'];

for (const symbol of watchlist) {
  const {data, error} = await fundReverseLookup({query: {symbol, pageSize: 1}});
  if (error) {
    console.error(`${symbol}: ${JSON.stringify(error)}`);
    continue;
  }
  const top = data.data[0];
  console.log(
    `${symbol.padEnd(5)} held by ${String(data.totalResults).padStart(5)} funds; ` +
    `largest position: ${top.fundTicker ?? top.fundName} ` +
    `($${(top.valueUsd / 1e9).toFixed(1)}B, ${top.pctVal.toFixed(2)}% of the fund)`
  );
}NVDA held by 2215 funds; largest position: VTI ($127.8B, 6.42% of the fund)
AAPL held by 1996 funds; largest position: VTI ($118.3B, 5.94% of the fund)
MU held by 1369 funds; largest position: VTI ($12.1B, 0.61% of the fund)Already at three tickers the shape of the data shows through. The number of ETFs and funds holding each name tracks index membership more than fame: NVIDIA is in more funds than Apple. And the same fund tells three different stories through its portfolio weight: Micron's largest holder by dollars is the same VTI, but at a 0.61% weight it is a passive passenger there, while the QQQ position behind it runs 2.15% of the fund. Extend the loop with a weight threshold and you have a crowding screen; feed it your whole book and you have a concentration report.
The fund-of-funds direction: which funds hold an ETF
Because N-PORT positions are resolved to entities, not just to operating companies, the lookup accepts a fund's ticker too. Ask which funds hold QQQ itself:
GET /api/fund/reverse-lookup?symbol=QQQ&pageSize=3

{
  "totalResults": 124,
  "data": [
    { "fundTicker": "DXQLX", "fundName": "Direxion Monthly NASDAQ 100 Bull 1.75X Fund",
      "valueUsd": 331972042.05, "pctVal": 65.5179731492, "reportDate": "2026-02-28" },
    { "fundTicker": "HCMSX", "fundName": "HCM Tactical Plus Fund",
      "valueUsd": 319870847.28, "pctVal": 17.82423775944, "reportDate": "2026-03-31" },
    { "fundTicker": "KAGIX", "fundName": "Kensington Dynamic Allocation Fund",
      "valueUsd": 200471929.4, "pctVal": 14.1009386363, "reportDate": "2026-03-31" }
  ]
}
124 registered funds hold QQQ as a position, led by a leveraged fund whose QQQ share position alone is 65.5% of its assets, followed by tactical-allocation funds using it as their equity sleeve. This is where exposure becomes composable: chain the weights and you get look-through exposure. A fund carrying a 65.5% QQQ position indirectly holds about 5.7% NVIDIA through those shares (65.5% of QQQ's 8.68% NVIDIA weight), before any exposure the fund adds through derivatives, which N-PORT reports separately. Fund-of-funds structures, allocation models, and leveraged wrappers all become visible the moment the holdings index runs in both directions.
Beyond exposure: overlap, composition, and the rest of the fund API
Reverse lookup answers “who holds this stock?”. The surrounding fund endpoints answer the follow-ups. /api/fund/holdings returns a fund's full quarterly holdings from N-PORT, the forward direction of the same data. /api/fund/overlap compares two funds by shared holdings, the natural next question once you notice a stock sitting in many of them. Composition, flows, fees, and performance round out the family; the ETF deep lens guide walks the whole surface, and for fund identity edge cases (tickers are messier than they look) there is a field guide to mapping fund CIKs to tickers. If the question is not just which funds hold a stock but why, whether it fits a fund's stated theme, see how to analyze ETF thematic exposure via API. For a worked comparison across a themed set of funds at once, see the best AI ETFs 2026 breakdown, which grades five AI-labeled ETFs on real Nvidia weight, overlap, and fees.
The ETF reverse lookup API is on the ETF ($39/mo annual) and Professional ($69/mo annual) plans. The free tier includes the fund profile and the supported-funds list, so you can explore the surface before subscribing, no credit card required.
FAQ
Q.How do I find all ETFs that hold a specific stock?
Q.What is an ETF reverse lookup API?
Q.Where does the ETF holdings data come from?
Q.How current is ETF holdings data from N-PORT?
Q.Does the reverse lookup include mutual funds or only ETFs?
Q.Why do some funds in the response have no ticker?
Q.Which subscription tiers include the ETF reverse lookup API?
Ready to build?
Free API key, no credit card.