Best AI ETFs in 2026: What to Watch This Year
Best AI ETFs in 2026 ranked by real exposure to Nebius, CoreWeave, Vertiv, and other AI-infrastructure plays, not Nvidia weight alone.
I keep coming back to the same thought: AI is not a trend to watch from the sidelines, it's the biggest shift in how value gets created that most of us will see in our working lives. That's genuinely exciting, and if I'm honest, a little intimidating too, because it means the real winners are being decided right now, inside infrastructure most investors never look at directly. Capturing that shift should not mean settling for whichever fund's fact sheet mentions Nvidia the most.
Every “best AI ETFs” roundup this year reads the same fact sheets: a paragraph of prose about artificial intelligence exposure, a top-holding percentage, and a one-year return. Most also default to the easiest available number: how much Nvidia a fund holds. That metric is close to meaningless on its own, every fund marketed as an AI ETF already owns Nvidia. It says nothing about which fund actually gives you exposure to the companies still early in capitalizing on the AI buildout, the infrastructure layer rather than the GPU everyone already knows about.
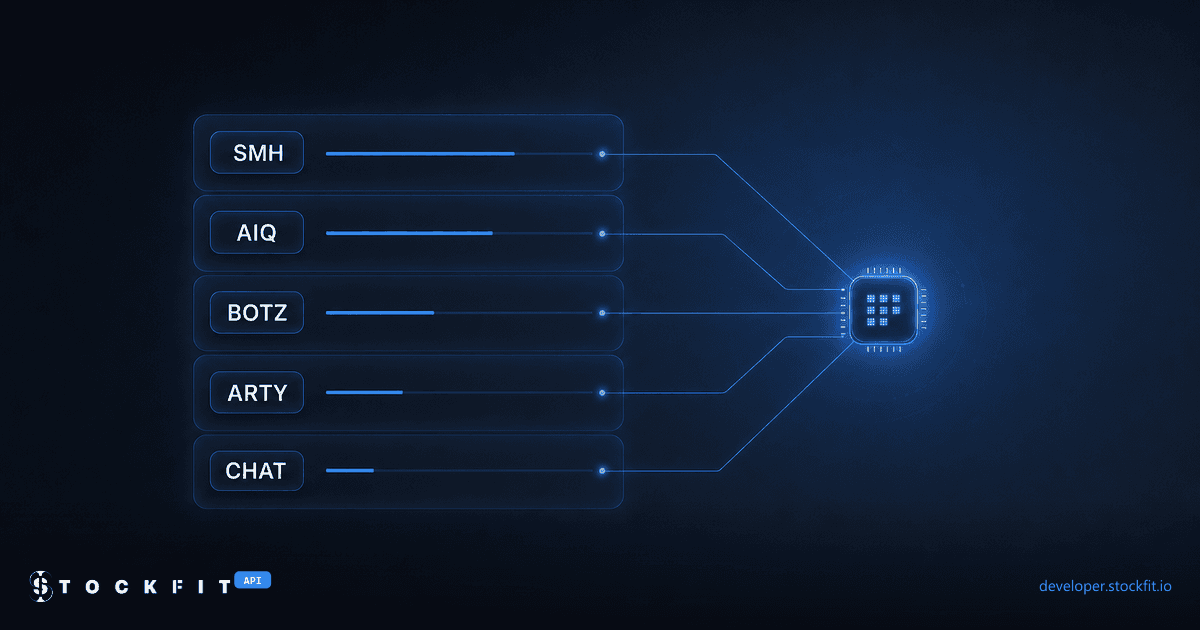
This post starts differently. First: real research into seven companies, described and reasoned about below, whose businesses are structurally tied to that infrastructure buildout, chosen independently of any fund that might hold them. Second: every one of the five ETFs conventionally grouped as “AI ETFs,” VanEck Semiconductor ETF (SMH), Global X Artificial Intelligence & Technology ETF (AIQ), Global X Robotics & Artificial Intelligence ETF (BOTZ), iShares Future AI & Tech ETF (ARTY), and Roundhill Generative AI & Technology ETF (CHAT), checked against that list using each fund's full N-PORT holdings via /api/fund/holdings and /api/fund/reverse-lookup, not just the top 10 a fact sheet shows. That process also surfaced a sixth fund never marketed as part of this group. Every number below is a verbatim field from a live API response, captured the same week this post was written; this is not investment advice, just verified data on what these funds actually hold.
What “AI exposure” actually means versus what the fact sheet says
“AI ETF” is not a regulatory category or a standardized index methodology. It is a marketing label that five very differently constructed funds all claim. A market-cap-weighted semiconductor index, a diversified basket of AI application-layer companies, an industrial-robotics fund, and a concentrated generative-AI bet are all sold under some version of the same story. The fact sheet tells you the story; it does not tell you how much of the fund is actually in the companies still positioned to benefit from where AI infrastructure spending goes next.
The only way to answer that is to read the fund's own quarterly N-PORT holdings filing in full and its SEC Form N-1A fee table, not the summary paragraph on the issuer's product page. That is what every figure in this post is sourced from: no third-party aggregator, no analyst estimate, every weight traceable to a specific N-PORT report date.
The real AI plays beyond Nvidia: 7 stocks, and why
Before looking at a single fund, we picked these seven companies on their own merits: businesses whose revenue is structurally tied to the AI infrastructure buildout, not the model layer or the GPU trade everyone already knows. None of them were chosen because a fund holds them; the fund research came after, in the next section.
AI "neocloud": builds and rents out full-stack GPU cloud infrastructure as an alternative to hyperscaler capacity. Revenue grew 684% y/y in Q1 2026 and 454% y/y in Q2 2026.
The largest independent AI-specialized cloud compute provider, with multi-year contracts to supply GPU capacity to Microsoft and OpenAI. 2025 revenue rose roughly 168% to near $5.1B.
Supplies the power and liquid-cooling systems data centers need as AI racks push power density far past what air-cooled infrastructure was built for.
Builds the high-speed Ethernet switching that links thousands of GPUs into a single training cluster inside hyperscaler AI data centers.
Co-designs custom AI accelerators directly with hyperscalers, including Amazon's Trainium and Microsoft's Maia chips; custom-silicon revenue reached $1.5B in fiscal 2026.
Makes the connectivity chips (PCIe/CXL retimers, and now AI fabric switches) that eliminate data bottlenecks inside AI server racks. FY2025 revenue grew 115% to $852.5M.
Supplies the electrical and optical interconnects (SerDes, DSPs, and, after its DustPhotonics acquisition, silicon photonics) AI clusters use to move data at up to 1.6T. FY2026 revenue more than tripled to $1.3B.
None of these seven show up in every AI-labeled fund, and one of the five funds in this post holds none of them at all. That gap between the “AI ETF” label and real exposure to this list is the actual finding.
How we compared these AI ETFs: methodology
Two steps. First, the list above, arrived at independently of any fund's holdings. Second, for each of the five funds conventionally sold as “AI ETFs,” full N-PORT holdings pulled via /api/fund/holdings (not just the top 10 shown by /api/fund/composition) and matched against all seven thesis tickers, then every thesis ticker run through /api/fund/reverse-lookup to check for any fund holding it that was not already in that candidate set. The five funds themselves are still the ones that show up across current “best AI ETF” coverage from major finance publishers; the difference here is what they get graded on: real exposure to a researched list of infrastructure plays, not a single stock's weight. Portfolio concentration, industry-group composition, pairwise overlap, and cost are included further down as supporting context pulled from the same endpoints, not the headline metric.
curl 'https://api.stockfit.io/api/fund/reverse-lookup?symbol=NBIS' \
-H 'x-api-key: YOUR_KEY'{
"data": [
{ "fundTicker": "CHAT", "fundName": "Roundhill Generative AI & Technology ETF", "pctVal": 2.0626386495525706 },
{ "fundTicker": "QQQJ", "fundName": "Invesco NASDAQ Next Gen 100 ETF", "pctVal": 2.359648253802 }
// ... 225 more
]
}Which AI ETF actually holds the real AI infrastructure plays
Summed across all seven thesis tickers, combined exposure ranges from zero to nearly 14% of the fund, and the ranking looks nothing like a ranking by Nvidia weight alone would:
ARTY (13.95%) and CHAT (13.62%) lead by a wide margin, and for different reasons than either fund gets credit for in most coverage. CHAT is the only fund of the five holding all seven names, Nebius, CoreWeave, Vertiv, Arista, Marvell, Astera Labs, and Credo, not just Nvidia and Alphabet. ARTY's exposure is concentrated in five of the seven (it holds neither Nebius nor Vertiv) but at higher individual weights, led by Marvell at 5.03% and CoreWeave at 4.90%. SMH and AIQ, despite being the two largest and most prominent funds in this group, land under 3% combined; SMH's cap-weighted index construction picks up Marvell and Astera Labs almost by accident as they grow into the index, and AIQ's 89-holding diversification dilutes its Marvell and CoreWeave positions to a rounding error. BOTZ holds none of the seven at all: a robotics-and-industrial-automation portfolio (Keyence, ABB, Fanuc, Intuitive Surgical) simply does not naturally overlap with cloud, networking, and interconnect infrastructure, whatever “AI” in its name implies.
Running the same seven tickers through /api/fund/reverse-lookup also surfaced a fund with no prior claim to belonging in this conversation at all:
BAI, iShares' actively managed A.I. Innovation and Tech Active ETF, was not part of the original five-fund candidate set; it turned up only because the reverse-lookup approach checks every fund that holds a thesis ticker, not just funds already labeled “AI.” Its combined thesis exposure (4.96%) sits below ARTY and CHAT, but two of its other positions are the more striking find: Anthropic Series G and OpenAI Series C, privately marked pre-IPO equity stakes, held directly inside an ETF a retail investor can buy today. Two caveats worth knowing before treating that as a reason to buy it: those are fair-value-level 3 assets (marked by the fund's own pricing committee, not a public market price), and the fund itself is barely 18 months old, growing from $19.6M to $13.35B in net assets over that span, a growth rate that says more about recent AI-fund inflows than about a long track record.
SMH, AIQ, BOTZ, ARTY, and CHAT: full fund comparison
With the headline finding established, here is how the same five funds compare on the metrics a fact sheet does show, plus the thesis-exposure column carried over from above:
curl 'https://api.stockfit.io/api/fund/composition?symbol=SMH' \
-H 'x-api-key: YOUR_KEY'{
"reportDate": "2026-03-31",
"top10": [
{ "name": "NVIDIA Corp", "mappedSymbol": "NVDA", "pctVal": 19.64418643136 },
{ "name": "Taiwan Semiconductor Manufacturing Co Ltd", "mappedSymbol": "TSM", "pctVal": 11.8409300759 }
// ... 8 more
],
"top10Weight": 72.189334899571
}| Fund | Net assets | Holdings | Top 10 wt | Thesis exp. | NVDA wt | Semis wt | Expense ratio |
|---|---|---|---|---|---|---|---|
| SMH | $40.98B | 26 | 72.2% | 2.80% | 19.64% | 86.2% | 0.35% |
| AIQ | $10.85B | 89 | 42.7% | 1.57% | 2.70% | 27.0% | 0.68% |
| BOTZ | $3.74B | 62 | 59.0% | 0.00% | 8.28% | 8.3% | 0.68% |
| ARTY | $2.08B | 65 | 47.8% | 13.95% | 4.67% | 34.5% | 0.47% |
| CHAT | $1.43B | 41 | 46.1% | 13.62% | 6.95% | 36.4% | 0.75% |
The five funds are not variations on the same portfolio; they are five different bets that happen to share a marketing label.
SMH is a market-cap-weighted semiconductor index, not an AI-application fund. With only 26 holdings and 72.2% concentrated in its top 10, it is the purest and most concentrated way in this group to hold the chip layer the entire AI buildout runs on, with 86.2% of the fund classified as Semiconductors by industry group. It is also the cheapest, at 0.35%. Its thin thesis exposure (2.80%) is a byproduct of cap-weighting, not a deliberate bet: Marvell and Astera Labs entered the index only as they grew large enough to qualify.
AIQ is the opposite construction: 89 holdings, only 42.7% in the top 10, and Nvidia sitting outside the fund's own top 10 entirely at 2.70% (confirmed independently via the overlap endpoint below). Memory and hardware names lead instead: SK hynix, Micron, and Samsung Electronics are three of AIQ's top five positions, alongside Oracle and Apple further down. It is the broadest, most diversified fund in the group, but that diversification also caps its thesis exposure at just 1.57%, the lowest of the five, since an 89-way split leaves little room for any single infrastructure name to matter.
BOTZ is not primarily a chip fund at all. Its top five holdings, Keyence, ABB, Fanuc, Nvidia, and Intuitive Surgical, are led by three industrial-automation manufacturers, and 8.3% of the fund is classified Semiconductors versus 5.7% Software & SaaS. It is also the only fund of the five with zero exposure to any of the seven thesis stocks: nothing in Nebius, CoreWeave, Vertiv, Arista, Marvell, Astera Labs, or Credo shows up anywhere across its 62 holdings. “Robotics and AI” in BOTZ's name means industrial automation, full stop, not the infrastructure layer this post is about.
ARTY is the newest and smallest fund in the group by net assets, and the fund with the highest combined thesis exposure of the five (13.95%), led by Marvell at 5.03% and CoreWeave at 4.90%, an AI cloud-infrastructure name that only recently went public. At 0.47% it is also the cheapest of the four application-layer funds (only SMH's pure-index construction is cheaper), targeting what its issuer calls the full AI technology stack rather than one layer of it.
The obvious read on CHAT, a concentrated generative-AI bet on Alphabet and Nvidia with only 41 total holdings, undersells it: CHAT is the only one of the five funds holding all seven thesis stocks, and its combined exposure (13.62%) is a close second to ARTY. That breadth of real infrastructure exposure inside such a concentrated fund is the most surprising result in this post. It is also the only fund whose N-1A fee table on file has not been refiled since 2024-08-27, worth checking directly before assuming the 0.75% rate is still current.
For comparison: which AI ETF has the most Nvidia exposure
This is the metric most “best AI ETF” roundups lead with, and it is worth showing for comparison, but it ranks the funds almost the opposite way the thesis-exposure metric above does. Nvidia is the one position all five funds share, but not by anywhere close to the same weight: it ranges from 2.70% of AIQ to 19.64% of SMH, a nearly 7.3x difference between two funds both marketed as AI plays.
SMH's number is a direct consequence of market-cap weighting a 26-stock semiconductor index during Nvidia's run to become the industry's largest company by far, the same mechanism that gives SMH its lowest-in-group thesis exposure above. AIQ's much lower Nvidia figure is a direct consequence of the opposite design choice: 89 holdings spread across hardware, software, and platform companies means no single position, Nvidia included, can dominate the portfolio the way it does in a concentrated index fund. Neither number says anything about exposure to the seven names in this post's thesis list, which is exactly why it is presented here as secondary context rather than the post's headline ranking.
Chip layer vs software layer: industry-group weight by fund
StockFit classifies every fund holding into one of eight industry groups derived from the underlying company's SIC code; Semiconductors and Software & SaaS are two of them, and they are the closest numeric proxy this data offers for “hardware layer” versus “software and platform layer” AI exposure. Pulled via /api/fund/chart/industry-groups for each fund's latest reported quarter:
SMH and CHAT both skew hardware-heavy (semiconductor weight well above software weight); AIQ is close to an even split between the two; BOTZ is dominated by neither, since most of its industrial-automation holdings (Keyence, Fanuc, ABB) fall outside both classifications entirely. No fund in this group is a pure software or pure application-layer AI bet by this measure, underscoring how much of “AI investing” in 2026 is still, structurally, chip investing.
Overlap and concentration risk: these funds are not interchangeable
Holding two or three of these funds for diversification only works if their portfolios do not already overlap heavily. /api/fund/overlap compares any two funds' most recent N-PORT holdings directly:
| Pair | Shared holdings | Overlap wt (fund A) | Overlap wt (fund B) |
|---|---|---|---|
| SMH vs AIQ | 11 | 65.1% | 28.9% |
| AIQ vs BOTZ | 6 | 8.3% | 16.3% |
| SMH vs CHAT | 8 | 44.9% | 29.8% |
| ARTY vs CHAT | 15 | 49.6% | 42.6% |
AIQ and BOTZ, both Global X funds, both nominally “AI,” share only 6 holdings, 8.3% of AIQ and 16.3% of BOTZ: pairing them is genuine diversification, not doubling up. SMH and AIQ share 11 names, but the overlap weight is lopsided, 65.1% of SMH versus just 28.9% of AIQ, because SMH's concentrated construction means every shared name counts for more of the fund. More relevant to this post's finding: ARTY and CHAT, the two funds with real exposure to this post's thesis list, overlap on 15 holdings worth 49.6% of ARTY and 42.6% of CHAT, substantially redundant. Buying both does not meaningfully diversify your thesis-stock exposure beyond owning whichever one you'd pick alone.
Fees, assets, and how fast money is flowing into AI ETFs
Expense ratios across the five range from 0.35% (SMH, a passive index fund) to 0.75% (CHAT, the smallest and most actively curated fund), pulled from each fund's SEC Form N-1A fee table via /api/fund/fees rather than a marketing page, since a prospectus fee table is a legal disclosure, not an estimate. Asset growth tells a related but distinct story:
Every fund grew, but not evenly. SMH and AIQ, the two funds with the clearest single-thesis story (pure semiconductor beta, broad AI application basket), pulled in the most capital in absolute terms, despite ranking lowest on real thesis-stock exposure. BOTZ, the industrial-robotics-leaning fund, grew the slowest of the five by a wide margin. Popularity and AI-label recognition, in other words, have tracked the obvious Nvidia trade more than they have tracked exposure to the less obvious infrastructure names in this post's thesis list. /api/fund/profile returns this same net-assets series, plus monthly returns and quarterly sales and redemptions, for any fund ticker.
AI ETF price growth, returns, and fee stability over the past few years
Portfolio weight explains what a fund holds; it does not explain what an investor actually experienced holding it. That is share price, the trailing returns each fund reports in its own SEC shareholder report, and whether the expense ratio quietly moved while nobody was looking. All three draw on filing types this post has not used yet: monthly price history, N-CSR/N-CSRS shareholder reports, and the full history of N-1A fee-table filings on record, not just the latest one, going back as far as /api/price/history and /api/fund/fees have data for each fund.
Since each fund's own starting point, share price is up 397% for SMH (from 2021), 328% for AIQ and 224% for ARTY (both from 2018), 140% for BOTZ (from 2016), and 221% for CHAT since its 2023 inception. ARTY needs a caveat before that number means what it looks like: the fund traded as IRBO, iShares Robotics and Artificial Intelligence Multisector ETF, tracking a different index, until 2024-08-12, when it renamed to iShares Future AI & Tech ETF and switched to the Morningstar Global Artificial Intelligence Select Index. Everything on this chart before that date reflects IRBO's old robotics-and-multisector strategy, not the AI-infrastructure thesis the rest of this post grades ARTY on, so ARTY's long-run price line is really two different funds spliced together at one ticker.
| Fund | Shareholder report as of | 1-yr return | 5-yr return (ann.) | 10-yr return (ann.) |
|---|---|---|---|---|
| SMH | 2024-09-30 | 70.26% | 33.92% | 26.87% |
| SMH | 2025-09-30 | 33.62% | 31.10% | 30.74% |
| AIQ | 2024-11-30 | 30.58% | 17.86% | — |
| AIQ | 2025-11-30 | 29.42% | 14.45% | — |
| BOTZ | 2024-11-30 | 25.81% | 9.43% | — |
| BOTZ | 2025-11-30 | 6.12% | 2.27% | 10.25% |
| ARTY | 2024-09-30 | 13.33% | 6.99% | — |
| ARTY | 2026-06-04 | 47.47% | 2.49% | — |
| CHAT | 2025-04-30 | 7.98% | — | — |
| CHAT | 2026-07-09 | 122.06% | — | — |
The rename shows up even more clearly in ARTY's own reported returns. Its trailing 1-year return was 13.33% as of 2024-09-30 (almost entirely the old IRBO strategy), then -7.61% as of 2025-03-31 (a report straddling both identities), before landing at 47.47% as of 2026-06-04, the first annual report to fall entirely inside the current AI mandate. Treat ARTY's 5-year figures in the table above the same way: they mostly describe a fund that, by strategy, no longer exists. CHAT shows a cleaner version of the same AI-inflows story this post's net-assets chart already told: trailing 1-year return went from 7.98% as of 2025-04-30 to 122.06% as of 2026-07-09, no rename involved, just a much stronger year. SMH, the oldest and steadiest fund here, is the only one with a full 10-year annualized figure on file: 30.74% as of 2025-09-30.
| Fund | Earliest N-1A on record | Most recent N-1A | Rate changed? |
|---|---|---|---|
| SMH | 0.35% (2011-11-21) | 0.35% (2026-01-27) | No |
| AIQ | 0.68% (2018-05-04) | 0.68% (2026-03-28) | No |
| BOTZ | 0.68% (2016-08-11) | 0.68% (2026-03-28) | No |
| ARTY | 0.47% (2018-07-03) | 0.47% (2026-07-27) | No |
| CHAT | 0.75% (2023-05-12) | 0.75% (2024-08-27) | No |
Fees are the boring line in this section, and that is itself the finding: SMH, AIQ, and CHAT charged the exact same expense ratio on every N-1A filing on record, and ARTY did too (unchanged across all 14 filings on record, including through the 2024 IRBO-to-ARTY rename). BOTZ is the closest thing to an exception, and even that was a one-basis-point blip (briefly 0.69% across three 2023 filings before reverting to 0.68%) rather than a real change. The one fund in this whole post whose cost genuinely moved is BAI: gross expense ratio stepped down from 0.68% to 0.65% between its 2024-10-16 and 2025-11-21 N-1A filings, while its net rate held at 0.55% throughout via a shrinking fee waiver, the same waiver flagged as worth rechecking earlier in this post. Its share price is up 78% since its 2024-10-01 launch, over a period too short for its own N-CSR shareholder report to exist yet, which is why BAI has no row in the returns table above.
FAQ
Q.Which AI ETF actually holds real AI-infrastructure plays like Nebius or CoreWeave, not just Nvidia?
CHAT and ARTY lead by a wide margin, with combined exposure of 13.62% and 13.95% respectively across seven researched thesis stocks (Nebius, CoreWeave, Vertiv, Arista, Marvell, Astera Labs, and Credo). CHAT is the only fund holding all seven; ARTY holds five at higher individual weights. SMH and AIQ, despite being the two largest and most recognized AI ETFs, land under 3% combined, and BOTZ holds none of the seven at all. A sixth fund, BAI (iShares A.I. Innovation and Tech Active ETF), was not part of the original candidate set but surfaced with real, if smaller, exposure once every thesis ticker was checked against every fund holding it.Q.What is the best AI ETF in 2026?
Q.Which AI ETF has the most Nvidia exposure?
Q.What is the difference between SMH, AIQ, BOTZ, ARTY, and CHAT?
Q.Do AI ETFs actually overlap in their holdings?
ARTY and CHAT, this post's two thesis-exposure leaders: they share 15 holdings worth 49.6% of ARTY and 42.6% of CHAT, meaningfully redundant if you were hoping to hold both for diversification. Check any two funds directly via /api/fund/overlap before assuming two funds you hold are actually diversifying each other.Q.How much do AI ETFs cost in fees?
Q.How current is ETF holdings data from N-PORT?
Q.Are AI ETFs risky because of concentration in a few chip stocks?
Q.Does any AI ETF hold OpenAI or Anthropic stock directly?
BAI (iShares A.I. Innovation and Tech Active ETF), the bonus fund this post's methodology surfaced, holds privately marked stakes in both Anthropic Series G (0.44% of the fund) and OpenAI Series C (0.35%), disclosed on its N-PORT filing at fair-value level 3, meaning the fund's own pricing committee marks them rather than a public market price. That is a real way to gain indirect exposure to both companies before either goes public, alongside real (if smaller than ARTY or CHAT) exposure to this post's thesis-stock list.Q.How have these AI ETFs' returns, prices, and fees changed over the past few years?
CHAT's trailing 1-year return went from 7.98% to 122.06% as AI-fund inflows accelerated. ARTY's swung from 13.33% to -7.61% to 47.47% across its 2024-08-12 rename from IRBO to ARTY, a strategy and index change, not just a new ticker, so its longer-lookback figures blend two different funds. Share prices are up anywhere from 140% (BOTZ, since 2016) to 397% (SMH, since 2021); see the price-growth chart above for the full multi-year picture. Fees barely moved by comparison: SMH, AIQ, ARTY, and CHAT charged the same expense ratio on every N-1A filing on record, BOTZ dipped one basis point for a single year, and only bonus fund BAI's rate actually changed, stepping down as its fee waiver shrank.Verifying any of this yourself
Every number in this post traces back to a live API call against the endpoints linked throughout, and every one of the five main funds is also available as a structured, source-quoted exposure model that reads each fund's own prospectus and cites the exact filing section and quote behind its stated strategy; the ETF thematic exposure API walkthrough works through that endpoint end to end on ARKK. For the full tour of every fund endpoint StockFit exposes, from the free-tier profile call through flows, overlap, and fee analysis, see A Deep Lens on Any ETF. To check whether a specific stock, one of this post's seven thesis names or any other, sits inside any fund, the reverse ETF lookup walkthrough covers /api/fund/reverse-lookup directly, the same endpoint this post used to find BAI. The full ETF data API covers more than twenty fund endpoints beyond the ones used here.
For primary-source reading on how the SEC requires funds to disclose holdings and strategy, the EDGAR full-text search at sec.gov/search-filings is where every N-PORT and N-1A filing behind this post's numbers ultimately lives.
Ready to build?
Free API key, no credit card.