ETF Analysis: Free-Tier to Forensic Techniques Explained
Walk SPY end-to-end with the StockFit fund endpoints: profile, holdings, flows, overlap, fund health, and fee analysis from N-PORT and N-CEN filings.
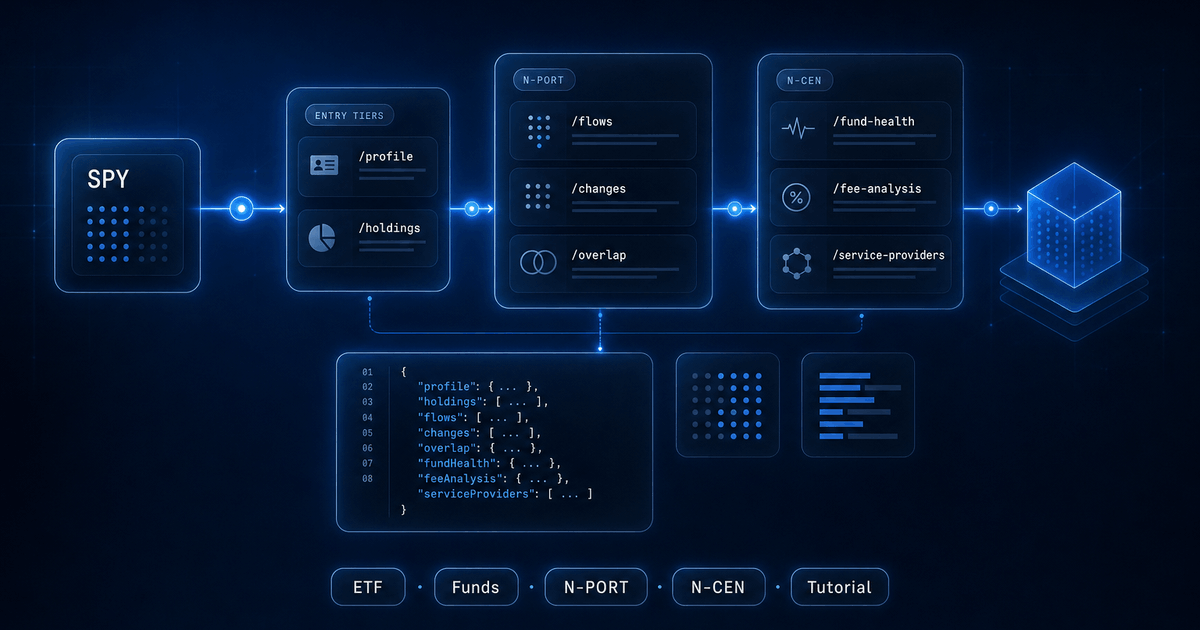
An ETF ticker is a black box on most data APIs. You get a name, an expense ratio, maybe a top-10 list. Behind the ticker the SEC actually requires the issuer to file a quarterly portfolio (N-PORT) and an annual operational census (N-CEN), and those filings are dense. The StockFit fund endpoints normalize both into JSON keyed on the same ticker symbol you would type into a brokerage. This post walks one ETF end-to-end through every fund endpoint, so you can see exactly how far a developer can push the analysis before reaching for another vendor. (If you want a primer on the fund-form family more broadly — N-PORT, N-CEN, N-1A, N-CSR — the SEC Forms field guide covers each one in plain English.)
We will use SPY as the running example. Two endpoints are reachable from the entry tiers: /api/fund/profile on Free and /api/fund/holdings on Starter. The remaining twelve sit behind the ETF or Pro tier and unlock flows, rebalancing telemetry, sector trajectories, fund-health diagnostics, fee mechanics, service-provider rosters, and cross-fund overlap. Every JSON snippet below is a verbatim slice from a live response captured the same day this post was written.
1. Fund Profile: the size and shape on the free tier
The profile endpoint is the smallest sufficient call for an ETF's identity card: net assets, holding count, monthly returns, and gross sales/redemptions per quarter, derived from N-PORT. Each row is one quarterly filing, newest first. A free-tier key returns the most recent quarters; paid tiers extend history. (Resolving the fund by its ticker or CIK in the first place is its own ordeal, which we cover in mapping a fund's CIK to its ticker.)
curl 'https://api.stockfit.io/api/fund/profile?symbol=SPY' \
-H 'x-api-key: YOUR_KEY'[
{
"reportDate": "2025-12-31",
"totalAssets": 714279299481,
"totalLiabilities": 2206759226,
"netAssets": 712072540255,
"returnMon1": 2.33,
"returnMon2": 0.23,
"returnMon3": 0.05,
"totalSales": 303112952193.25,
"totalRedemptions": 279346630139.35,
"holdingCount": 503
},
// ... older quarters
]Three things are immediately useful on the free tier:
netAssetsis the AUM you would quote in a fund card. SPY landed at $712.07B on 2025-12-31, up from $623.80B a year prior.totalSalesminustotalRedemptionsis the quarter's gross creation/redemption flow. For SPY Q4 2025 that is+$23.77Bnet inflow, on $303B of gross primary-market activity.returnMon1..Mon3are the three monthly NAV returns the issuer reports inside the quarter. They are not derived from prices; they come from the filing itself.
Useful pattern: stitch the array tail-to-head and you get a multi-year time series of AUM and gross flows in one call, no pagination needed. Visualized, the SPY AUM trajectory from a single profile call looks like this:
const profile = await fetch(
  'https://api.stockfit.io/api/fund/profile?symbol=SPY',
  { headers: { 'x-api-key': process.env.STOCKFIT_API_KEY } }
).then(r => r.json());

const aumSeries = profile
  .map(q => ({ date: q.reportDate, aum: q.netAssets, holdings: q.holdingCount }))
  .reverse();
// → [{ date: '2019-09-30', aum: 273_532_222_565, holdings: 505 }, ..., {date: '2025-12-31', aum: 712_072_540_255, holdings: 503 }]2. Fund Holdings: the line-by-line book on Starter
Holdings is the first endpoint that opens the box. It returns one row per position from the most recent N-PORT, sorted by portfolio weight descending, paginated. Each row carries the value in USD, percent of portfolio, balance (number of shares for equities), CUSIP, ISIN, country, fair-value level, and where possible a mapped CIK and ticker so you can join straight back to company endpoints without a separate lookup.
curl 'https://api.stockfit.io/api/fund/holdings?symbol=SPY&pageSize=10' \
-H 'x-api-key: YOUR_KEY'{
"page": 1, "pageSize": 10, "totalPages": 51, "totalResults": 503,
"reportDate": "2025-12-31",
"data": [
{
"name": "NVIDIA Corp",
"cusip": "67066G104", "isin": "US67066G1040",
"valueUsd": 55218508208,
"pctVal": 7.754618397194,
"balance": 296077792,
"units": "NS",
"assetCat": "EC", "issuerCat": "CORP", "country": "US",
"payoffProfile": "Long",
"fairValueLevel": 1,
"mappedCik": 1045810,
"mappedSymbol": "NVDA"
},
{ "name": "Apple Inc", "mappedSymbol": "AAPL", "pctVal": 6.873651465298 },
{ "name": "Microsoft Corp", "mappedSymbol": "MSFT", "pctVal": 6.150453900958 },
{ "name": "Amazon.com Inc", "mappedSymbol": "AMZN", "pctVal": 3.842171727492 },
{ "name": "Alphabet Inc", "mappedSymbol": "GOOGL","pctVal": 3.116228390867 },
// ... 498 more
]
}Two non-obvious signals hide in here. fairValueLevel is the ASC 820 fair-value hierarchy: 1 means the position is priced from a quoted market, 2 means observable inputs, 3 means unobservable. For a plain-vanilla equity ETF every row should be Level 1, and SPY's 503 holdings all are. When you screen funds at scale, a non-zero count of Level 2 or 3 holdings is a tell that the fund holds something illiquid (private credit, restricted securities, OTC derivatives) regardless of the marketing copy.
mappedSymbol is the join key. N-PORT itself is keyed on CUSIP, which is fine for a back-office system but inconvenient for a developer who wants to fetch fundamentals on every constituent. The endpoint resolves CUSIP into ticker plus CIK where it can, so the obvious next call works without a detour through a CUSIP-to-ticker service.
// Build a constituent → ticker map and pull income statements for the top 25.
const { data: holdings } = await fetch(
  'https://api.stockfit.io/api/fund/holdings?symbol=SPY&pageSize=25',
  { headers: { 'x-api-key': process.env.STOCKFIT_API_KEY } }
).then(r => r.json());

const tickers = holdings.map(h => h.mappedSymbol).filter(Boolean);
// → ['NVDA', 'AAPL', 'MSFT', 'AMZN', 'GOOGL', 'AVGO', 'GOOGL', ...]02079K305 and 02079K107). Each is a distinct row in N-PORT, and the API surfaces them faithfully. If you collapse by mappedSymbol you double-count Alphabet; collapse by cusip instead, or by `${mappedSymbol}-${cusip}`, depending on what you are trying to compute.With profile and holdings combined, you can already build a respectable fund detail page: AUM, monthly returns, holding count, the full constituent table with weights and value-in-USD, and outbound joins to every other StockFit company endpoint. That is the whole shipping budget on the entry tiers.
3. The wall: what the entry tiers cannot answer
Profile and holdings give you the snapshot. The questions a real ETF developer ends up asking next are mostly about motion, structure, and operational risk:
- How is the portfolio drifting over time? Sector mix, country mix, concentration.
- Which positions did the manager add, drop, or rebalance between the last two N-PORTs?
- How is creation/redemption flow trending month-by-month, not just per quarter?
- Two ETFs claim to track the same index: what is their actual overlap, and where do they diverge?
- Which other funds hold this stock, and at what weight?
- Is the fund actually tracking its index? How much of the variance is fees vs. tracking error?
- What is the fund's creation/redemption efficiency, and which brokers move the most volume?
- Who are the custodians, transfer agents, authorized participants, and pricing services? Are any affiliated?
None of that fits in /profile or /holdings. The remaining endpoints answer one such question each, and they all live on the ETF tier (or Pro, which includes ETF plus the equities power-tools).
4. Composition: the snapshot, pre-aggregated
Composition is the same N-PORT snapshot, pre-aggregated four ways: by asset type, by country, by issuer type, and as a top-10 list. It saves you the client-side group-by when all you want is the headline picture.
{
  "reportDate": "2025-12-31",
  "assetTypes":  [{ "category": "EC",   "count": 503, "weight": 99.99 }],
  "issuerTypes": [{ "category": "CORP", "count": 474, "weight": 98.29 },
                  { "category": "OTHER","count":  29, "weight":  1.70 }],
  "countries": [
    { "category": "US", "count": 474, "weight": 97.16 },
    { "category": "IE", "count":  15, "weight":  1.99 },
    { "category": "CH", "count":   3, "weight":  0.27 },
    { "category": "BM", "count":   4, "weight":  0.12 },
    { "category": "NL", "count":   2, "weight":  0.11 }
  ],
  "top10":       [/* same NVDA/AAPL/MSFT... rows trimmed for brevity */],
  "top10Weight": 39.229913671048
}
The top10Weight on SPY is 39.23%, which is the concentration metric a portfolio risk dashboard usually wants. The country breakdown is the surprise: SPY is supposed to be a US-only fund, and it is, by issuer revenue. But the issuer-of-record domicile is IE (Ireland) for 1.99% of the book and BM (Bermuda) for another 0.12%, because companies like Accenture, Aon, Linde, and Trane Technologies are domiciled abroad while operating mostly in the US. The endpoint is honest about that, where most marketing fact-sheets are not.
5. Flows: monthly granularity for primary-market activity
Profile collapses the quarter into a single sales/redemption pair. Flows breaks it open: each of the three months in the quarter has its own flowSalesMonN, flowReinvestMonN, flowRedemptionMonN, and returnMonN. That is the granularity you need to correlate net flow against return windows, dividend ex-dates, or specific volatility events.
{
  "reportDate": "2025-12-31",
  "returnMon1": 2.33, "returnMon2": 0.23, "returnMon3": 0.05,
  "flowSalesMon1": 78562466018.25,  "flowRedemptionMon1": 74102110197.80,
  "flowSalesMon2": 105278579174.30, "flowRedemptionMon2": 99419208419.30,
  "flowSalesMon3": 119271907000.70, "flowRedemptionMon3": 105825311522.25,
  "netAssets": 712072540255
}
Net flow per month for SPY in Q4 2025: +$4.46B, +$5.86B, +$13.45B. Trend is positive and accelerating into year-end despite a barely-positive return month. That sort of divergence between price and flow is exactly what algorithmic flow-followers care about, and you cannot reconstruct it from a quarter-level totals row.
6. Portfolio Changes: what the manager did
The /changes endpoint diffs the two most recent N-PORT filings and returns three arrays: added, removed, and (in the full response) reweighted. For an index-tracking ETF like SPY, this is effectively the S&P 500 reconstitution mirrored into the fund.
{
  "latestDate":   "2025-12-31",
  "previousDate": "2025-09-30",
  "added": [
    { "name": "Carvana Co",            "mappedSymbol": "CVNA", "pctVal": 0.1021 },
    { "name": "Sandisk Corp/DE",       "mappedSymbol": "SNDK", "pctVal": 0.0565 },
    { "name": "Ares Management Corp",  "mappedSymbol": "ARES", "pctVal": 0.0568 },
    { "name": "Qnity Electronics Inc", "mappedSymbol": "Q",    "pctVal": 0.0294 },
    { "name": "Comfort Systems USA Inc","mappedSymbol":"FIX",  "pctVal": 0.0562 }
    // ...
  ],
  "removed": [/* names that fell out between the two filings */]
}
For an actively-managed ETF, the same shape becomes a manager-decision feed: every new add carries its initial sizing, every removal carries the weight it had before being dropped. Pair the response with /api/filings filtered to type=N-PORT to get the filing dates, and you have a full rebalancing audit trail without parsing a single XML document.
7. Sector chart: the multi-year regime drift
Holdings tells you the current weights. The sector chart endpoint tells you the trajectory. Sector classification is SIC-based (the SEC's own taxonomy, joined to N-PORT holdings), and the response is already shaped for a stacked-area chart: one periods[] array of dates, one series[] per sector with one weight per period.
{
  "periods": ["2019-09-30", "2019-12-31", /* ... */ "2025-12-31"],
  "series": [
    { "name": "Manufacturing",                          "data": [38.13, 38.00, /* ... */ 44.12] },
    { "name": "Services",                               "data": [19.63, 20.31, /* ... */ 24.19] },
    { "name": "Finance/Insurance/Real Estate",          "data": [16.44, 16.67, /* ... */ 12.87] },
    { "name": "Retail Trade",                           "data": [ 9.38,  8.93, /* ... */  8.56] },
    { "name": "Transportation/Communications/Electric", "data": [10.50,  9.94, /* ... */  5.34] },
    /* Mining, Wholesale Trade, Construction... */
  ]
}
Plotted directly from the response, the six-year sector drift on SPY tells two stories:
Manufacturing climbed from 38.1% to 44.1% as the megacap tech names (NVIDIA, Apple, Broadcom) bloated their share of the index. Transportation/Communications/Electric/Gas/Sanitary, the SIC bucket that used to hold the legacy telcos and utilities, halved from 10.5% to 5.3%. The series is twenty-six quarters of pre-aggregated data per fund; you do not need to recompute it client-side, and it composes directly with charting libraries that expect {periods, series}.
/api/fund/chart/countries and /api/fund/chart/industry-groups have the same shape for geographic and industry-group cuts. /api/fund/chart/flows does the same for the monthly creation/redemption series.
8. Reverse Lookup: who else holds this stock
Same dataset, different axis. Pass any ticker (a stock, an ETF, a mutual fund) and you get the paginated list of funds that hold it, sorted by position size descending, each row carrying the holder's ticker, CIK, position value, percent of holder's portfolio, share count, and the holder's net assets.
{
  "page": 1, "pageSize": 5, "totalPages": 401, "totalResults": 2003,
  "data": [
    { "fundTicker": "VTSMX", "fundName": "VANGUARD TOTAL STOCK MARKET INDEX FUND",
      "valueUsd": 135302984018.5, "pctVal": 6.57, "fundNetAssets": 2057976411077 },
    { "fundTicker": "VOO",   "fundName": "VANGUARD 500 INDEX FUND",
      "valueUsd": 114281520142.5, "pctVal": 7.75, "fundNetAssets": 1474944667479 },
    { "fundTicker": "IVV",   "fundName": "iSHARES TRUST",
      "valueUsd":  58874410452.5, "pctVal": 7.74, "fundNetAssets":  760624025198 },
    { "fundTicker": "SPY",   "fundName": "SPDR S&P 500 ETF TRUST",
      "valueUsd":  55218508208,   "pctVal": 7.75, "fundNetAssets":  712072540255 },
    { "fundTicker": "FXAIX", "fundName": "FIDELITY CONCORD STREET TRUST",
      "valueUsd":  54795653828.76,"pctVal": 7.31, "fundNetAssets":  749107075784 }
  ]
}
That is NVDA: 2,003 funds hold it across the SEC universe. The endpoint is what you reach for when a customer asks “what's my actual NVDA exposure across all the ETFs I own”, or when you are building a co-ownership map for a quant signal.
9. Fund Health: tracking error, lending, fair value, defaults
This endpoint pulls together the operational signals from N-CEN (annual census) and N-PORT into one structured response. Tracking-error metrics (for index funds), the fair-value-hierarchy distribution, liquidity classifications, default and arrears counts on debt holdings, securities-lending activity, and a service-provider summary.
SPY's response is sparse on the N-CEN side because the SPDR S&P 500 ETF Trust is structured as a unit investment trust (UIT), which has lighter N-CEN reporting than the open-end 1940-Act funds. That is itself a useful signal: the empty ncenRecords[] tells you the fund is a UIT before you go looking. To show what the response looks like with full data, here is the same call against VOO (Vanguard 500), which is an open-end fund:
{
  "reportDate": "2025-12-31",
  "ncenRecords": [
    {
      "reportDate": "2025-12-31",
      "isIndexFund": true,
      "indexReturnDiffBefore": -0.00397999,   // % gross-of-fees vs. benchmark
      "indexReturnDiffAfter":  -0.16890000,   // % net-of-fees vs. benchmark
      "indexStdevBefore": 0.01187674,
      "indexStdevAfter":  0.01268580,
      "isLendingAuthorized": true,
      "didLend": true,
      "isLendingLiquidated": false,
      "hasMaterialWeakness":  false,
      "hasLegalProceedings":  false,
      "hasValuationChanges":  false,
      "hasAccountingChanges": false,
      "hasPaymentErrors":     false
    }
    // ... older annual rows
  ],
  "liquidity": [{ "category": null, "count": 506, "totalValue": 1474074202561.68, "totalWeight": 99.94 }],
  "fairValue": [
    { "level": 1, "count": 505, "totalWeight": 99.940983 },
    { "level": 3, "count":   1, "totalWeight": 1.2447e-8 }   // a single residual position
  ],
  "defaults": { "defaults": 0, "arrears": 0, "total": 506 },
  "serviceProviders": [/* trimmed, see §11 */]
}
The two indexReturnDiff fields are the single most important diagnostic on this endpoint. The Before figure is gross of fees (true tracking error from sampling and replication choices), After is net of fees. For VOO 2025: -0.40 bps gross, -16.9 bps net, which means almost all of the underperformance vs. the S&P 500 is the expense ratio burning off, not portfolio drift. That is the cleanest possible signal that an index fund is doing its job.
10. Fee Analysis: total cost of ownership beyond the expense ratio
Expense ratios are public, but the operational mechanics that cause the expense ratio are not on most data APIs. /fee-analysis exposes them: monthly average net assets, aggregate brokerage commissions paid out of fund assets, percent of creations and redemptions executed in-kind (the lower the cash component, the more tax-efficient the fund), expense waivers and recoupment flags, and per-broker commission breakdowns.
{
  "feeRecords": [
    {
      "reportDate": "2025-12-31",
      "monthlyAvgNetAssets":     1408456183321.80,
      "aggregateCommission":     4361773.78,
      "creationUnitShares":      25000,
      "avgPctPurchasedInKind":   92.56,    // % of creations done in-kind
      "avgPctRedeemedInKind":    99.68,    // % of redemptions done in-kind
      "isExpenseLimitation":     false,
      "isExpenseReducedOrWaived":false,
      "hasLineOfCredit":         true,
      "lineOfCreditSize":        4300000000
    }
  ],
  "brokerCommissions": [
    { "providerName": "CITIGROUP INC.",                    "commission": 1458077.00 },
    { "providerName": "JPMORGAN CHASE & CO.",              "commission":  951393.45 },
    { "providerName": "BARCLAYS PLC",                      "commission":  713099.80 },
    { "providerName": "BANK OF AMERICA CORPORATION",       "commission":  410190.14 },
    { "providerName": "Mizuho Financial Group, Inc.",      "commission":  279827.79 }
    /* ...truncated */
  ]
}
Two reads worth the call. First, avgPctRedeemedInKind at 99.68% on VOO is the tax-efficiency story behind why a Vanguard 500 ETF reliably distributes minimal capital gains: redemptions ship out securities, not cash, and the fund never realizes the embedded gain on the redeemed line. Second, the broker-commission table is a concentration map: the top broker took 33% of all of VOO's 2025 commissions. If you are evaluating execution-quality risk, that is a quantitative anchor.
11. Service Providers: the fund's supply chain
Every entity that touches a fund is disclosed in N-CEN: adviser, sub-adviser, administrator, custodian, transfer agent, pricing service, lending agent, authorized participants, brokers. /service-providers returns the full historical roster grouped by reporting year, with role, name, affiliation flag, file number, CRD number, LEI, and the commission paid where applicable.
{
  "providersByYear": [
    {
      "reportDate": "2025-12-31",
      "providers": [
        { "providerRole": "adviser",
          "providerName": "The Vanguard Group, Inc.",
          "fileNumber": "801-11953", "lei": "5493002789CX3L0CJP65" },
        { "providerRole": "custodian",
          "providerName": "State Street Bank and Trust Company",
          "isAffiliated": false, "lei": "571474TGEMMWANRLN572" },
        { "providerRole": "transfer-agent",
          "providerName": "The Vanguard Group, Inc.",
          "isAffiliated": true,  "lei": "5493002789CX3L0CJP65" },
        { "providerRole": "authorized-participant",
          "providerName": "Goldman Sachs",
          "lei": "FOR8UP27PHTHYVLBNG30",
          "commission": 64786360500 },
        { "providerRole": "authorized-participant",
          "providerName": "JP Morgan",
          "lei": "ZBUT11V806EZRVTWT807",
          "commission": 98412737250 }
        // ... 60+ more providers
      ]
    }
    // ... older years
  ]
}
VOO returns roughly 60 providers per year. The isAffiliated flag matters: an affiliated transfer agent (Vanguard transfer-agenting its own fund) is fine for a Vanguard product but would be a governance flag on a smaller issuer. The AP commission column is where you read the primary-market plumbing: in 2025, Merrill Lynch Pro processed the largest gross creation/redemption commission on VOO at $133.2B, with JP Morgan and Goldman next. Year-over-year deltas in this list tell you when an AP is gaining or losing market-making share on a specific fund.
12. Overlap: when two ETFs claim to track the same thing
Pass two tickers. Get back the merged holding table with both weights, plus headline overlap statistics. Matching is on CUSIP using the most recent N-PORT for each fund.
curl 'https://api.stockfit.io/api/fund/overlap?symbol1=SPY&symbol2=VOO' \
-H 'x-api-key: YOUR_KEY'{
"symbol1": "SPY", "symbol2": "VOO",
"reportDate1": "2025-12-31", "reportDate2": "2025-12-31",
"overlapCount": 476,
"onlyIn1Count": 27,
"onlyIn2Count": 30,
"overlapWeight1": 97.31,
"overlapWeight2": 97.04,
"holdings": [
{ "cusip": "67066G104", "name": "NVIDIA Corp", "mappedSymbol": "NVDA",
"weight1": 7.7546, "weight2": 7.7482, "overlapStatus": "both" },
{ "cusip": "037833100", "name": "Apple Inc", "mappedSymbol": "AAPL",
"weight1": 6.8737, "weight2": 6.8680, "overlapStatus": "both" },
/* ...500+ more rows including only-in-1 and only-in-2 entries */
]
}Two large-cap-US ETFs that everyone treats as interchangeable: 476 holdings shared, 27 unique to SPY, 30 unique to VOO, with 97.3% and 97.0% of the respective books overlapping by weight. The 3% sliver is sampling noise (different reconstitution timing, different treatment of share classes, different cash buffers), and the per-CUSIP holdings[] array tells you exactly which positions create the divergence. This is the right answer to “active share between two index funds”, computed off raw N-PORT instead of guessed from sector allocations.
13. The remaining endpoints in one paragraph each
Structure
The composite long-form endpoint. Sector allocation by quarter, geographic exposure by quarter, balance-sheet trajectory (assets, liabilities, leverage), index-vs-active classification, diversified-status flag, short-position counts, restricted-securities counts, and multi-currency exposure. Use it when you want one call to power a fund-strategy page; use the per-axis endpoints (sectors, countries, industry-groups) when you only want a chart.
Performance
Pulls returns and risk numbers from N-CSR (the annual/semi-annual shareholder report). Different cadence than N-PORT: lower frequency, deeper history, and includes the prospectus-style 1-year / 5-year / 10-year / since-inception buckets the fund itself reports.
Fees (schedule)
Fee-table snapshot: management fee, 12b-1, other expenses, total expense ratio, fee waivers. The narrow companion to /fee-analysis: /fees is the prospectus shape, /fee-analysis is the operational reality.
Exposure Model (audit-grade)
Lazily generated, audit-traceable factor decomposition of a fund's economic exposure. Distinct from the simple country/sector splits because each exposure ties back to underlying-issuer fundamentals, not just the issuer-of-record domicile. This is the endpoint that exposes “how much of SPY's revenue is actually US” rather than “how much of SPY's issuer registrations are US”.
A composite developer playbook
Putting it all together, here is the rough call sequence we use internally to build a one-pass fund report. It assumes an ETF-tier or Pro-tier key.
async function buildFundReport(symbol) {
  const headers = { 'x-api-key': process.env.STOCKFIT_API_KEY };
  const get = (path) =>
    fetch(`https://api.stockfit.io${path}?symbol=${symbol}`, { headers })
      .then(r => r.json());

  const [
    profile, composition, flows, changes, sectorChart, countryChart,
    health, fees, providers, structure
  ] = await Promise.all([
    get('/api/fund/profile'),
    get('/api/fund/composition'),
    get('/api/fund/flows'),
    get('/api/fund/changes'),
    get('/api/fund/chart/sectors'),
    get('/api/fund/chart/countries'),
    get('/api/fund/fund-health'),
    get('/api/fund/fee-analysis'),
    get('/api/fund/service-providers'),
    get('/api/fund/structure'),
  ]);

  const holdings = await fetch(
    `https://api.stockfit.io/api/fund/holdings?symbol=${symbol}&pageSize=1000`,
    { headers }
  ).then(r => r.json());

  return {
    snapshot: {
      asOf: profile[0].reportDate,
      aum: profile[0].netAssets,
      holdingCount: profile[0].holdingCount,
      top10Weight: composition.top10Weight,
    },
    flowsLastQuarter: {
      m1: flows[0].flowSalesMon1 - flows[0].flowRedemptionMon1,
      m2: flows[0].flowSalesMon2 - flows[0].flowRedemptionMon2,
      m3: flows[0].flowSalesMon3 - flows[0].flowRedemptionMon3,
    },
    rebalancing: {
      added:   changes.added.length,
      removed: changes.removed.length,
    },
    trackingError: health.ncenRecords?.[health.ncenRecords.length - 1] ?? null,
    inKindEfficiency: fees.feeRecords?.[fees.feeRecords.length - 1] ?? null,
    affiliatedProviders: providers.providersByYear[0]?.providers
      .filter(p => p.isAffiliated === true) ?? [],
    drift: { sectors: sectorChart, countries: countryChart },
    structure,
    holdings: holdings.data,
  };
}
Eleven calls, one composite. Same authentication, same JSON shapes, no third-party joins, every field traceable back to a specific N-PORT or N-CEN filing on EDGAR.
FAQ
Where does the data come from?
Every field on the fund endpoints originates from a public SEC filing. N-PORT is the quarterly portfolio filing (positions, weights, country, fair-value level, monthly returns, monthly flows). N-CEN is the annual operational census (tracking error, lending, fees, brokers, service providers, governance flags). N-CSR is the semi-annual/annual shareholder report (returns and risk numbers in the prospectus shape). The endpoints shape these into developer-friendly JSON; nothing is sourced from a third-party data vendor.
Do mutual funds work with the same endpoints?
Yes. Pass a mutual fund ticker (or its CIK) and the response shape is identical. ETFs and 1940-Act open-end funds both file N-PORT and N-CEN, so the same code paths work. Unit investment trusts (like SPY) have lighter N-CEN, so some fields can be empty for those funds; the schema does not change.
How recent is the data?
N-PORT is filed within 60 days of quarter-end and made public 60 days after that. The endpoints reflect filings as soon as they hit EDGAR, so the freshest reportDate you will see is normally one quarter behind today, sometimes two depending on the issuer's filing cadence. N-CEN is annual, with a similar lag.
Why are some fields empty on certain funds?
Two reasons. First, structural: a unit investment trust (SPY) does not file the same N-CEN sections as an open-end fund (VOO), so ncenRecords and feeRecords can be empty. Second, applicability: a pure-equity fund will have an empty defaults count because the section is for debt holdings. The endpoint preserves the SEC's shape rather than fabricating zeros, so an empty array is a real signal, not missing data.
What if I am on the Pro tier already?
Pro includes ETF plus the equities power-tools (insider transactions, ownership, executives, earnings calendar, etc.). All the endpoints discussed in this post are accessible. Pro is the right tier when you are building something that bridges fund analysis and single-name analysis, for example a portfolio that joins fund holdings to the constituents' insider activity or institutional ownership.
From ticker to forensic analysis, in one API
The free-tier /profile call gets you the size and shape. The Starter-tier /holdings call opens the book. The remaining twelve endpoints, all on ETF or Pro, take you into the operational layer that most data APIs do not expose at all: tracking error, in-kind efficiency, broker concentration, AP rosters, sector drift, cross-fund overlap. They share one authentication, one JSON conventional shape, and one source of truth, which is what every line item ultimately ties back to: an SEC filing on EDGAR. For the upstream view of how that EDGAR data gets normalized into clean JSON in the first place, see Converting XBRL Financials to JSON for Backtesting.
Ready to build?
Free API key, no credit card. Every endpoint mentioned in this post is available on the free tier.
Get Your Free API Key