REIT Property Schedule API: Schedule III Data
Get a REIT's per-property Schedule III data via API: cost basis, carrying value, and accumulated depreciation from the 10-K.
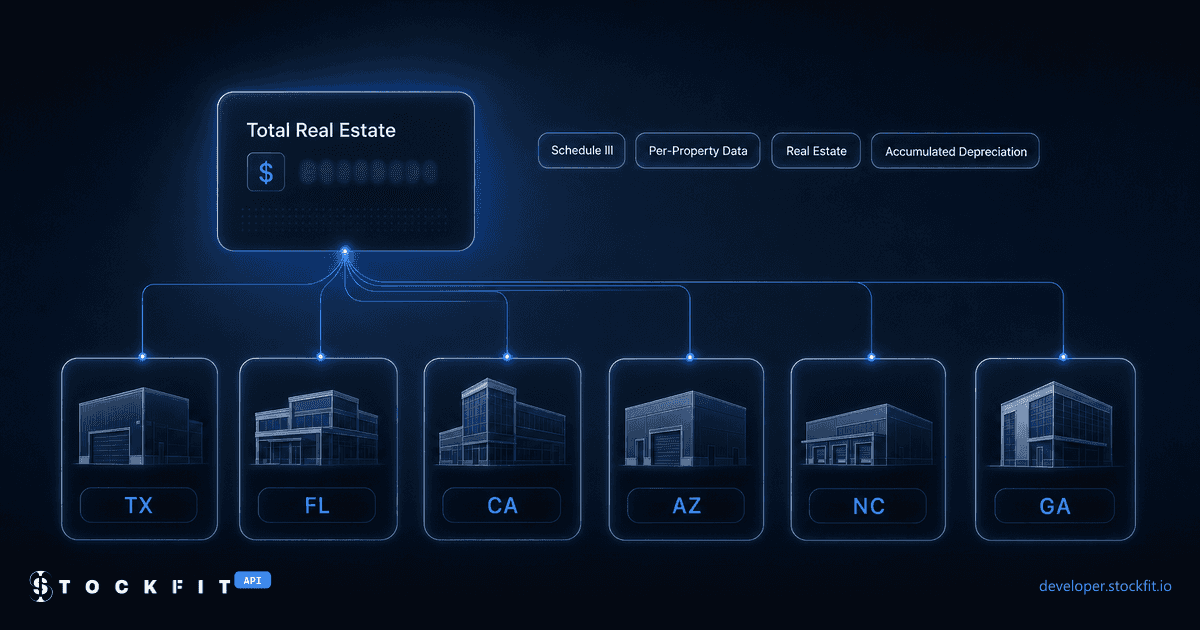
EastGroup Properties owns 469 industrial buildings across the Sunbelt. Its balance sheet reports that as one number: $5.4B in total assets as of 2025-12-31. Nothing in that figure says which state a given warehouse sits in, how much of a $133M logistics building is land versus structure, or that its Louisiana properties are already 67.4% depreciated while its Tennessee properties are barely 5.2% written down.
That detail lives in a specific, rarely-parsed disclosure: SEC Schedule III, Real Estate and Accumulated Depreciation, required under Regulation S-X Rule 12-28 for real estate investment trusts and similar registrants. It runs as an exhibit to the 10-K, one row per property or per named portfolio, and StockFit turns it into structured JSON through /api/footnotes/reit-properties. This post walks it end to end on EastGroup Properties' (EGP) real FY2025 filing, all 469 rows, cross-checked to the dollar against SEC's own data, plus what to watch for when a filer tags this schedule differently, or does not tag it at all.
What Schedule III discloses that a balance sheet does not
A REIT's balance sheet nets everything into one or two lines: real estate, net of accumulated depreciation. Schedule III breaks that number apart, property by property, into five figures that survive the extraction:
- Initial cost, split into land and buildings, the price paid at acquisition.
- Carrying amount, land and buildings again, but at current book value after any later adjustment.
- Gross carrying value, the full amount the property is carried at before depreciation.
- Accumulated depreciation, how much of that gross value has been written off so far.
- Capitalized improvements, capital spent on the property after acquisition, when a filer tags it.
Together, gross value minus accumulated depreciation tells you a property's current book value; accumulated depreciation as a share of gross tells you roughly how old it is. Land versus buildings in the initial cost tells you how much of the price was dirt versus structure. None of that survives a balance sheet's single net figure. The rule itself, and thousands of REITs' actual Schedule III exhibits, are public on SEC EDGAR for anyone willing to open a 10-K and find the schedule by hand.
Getting per-property REIT data via API
Call /api/footnotes/reit-properties with a ticker, CIK, CUSIP, or FIGI. period is annual (Schedule III is a 10-K-only disclosure) and limit controls how many fiscal years come back, a large REIT returns hundreds of properties per year, so keep limit small unless you actually need multi-year history. Trimmed to the two largest rows, EastGroup's real FY2025 response looks like this:
// GET /api/footnotes/reit-properties?symbol=EGP&period=annual&limit=1
{
  "period": "2025-12-31",
  "fiscalYear": 2025,
  "fiscalPeriod": "FY",
  "dateFiled": "2026-02-11",
  "properties": [
    {
      "member": "egp:SiempreViva36Member",
      "name": "Siempre Viva 36",
      "locationMember": "stpr:CA",
      "locationName": "CA",
      "currency": "USD",
      "initialCost": {"land": 31815000, "buildings": 100861000},
      "gross": 133415000,
      "accumulatedDepreciation": 13035000
    },
    {
      "member": "egp:DFWGlobalLogisticsCentre14Member",
      "name": "DFWGlobal Logistics Centre 14",
      "locationMember": "stpr:TX",
      "locationName": "TX",
      "currency": "USD",
      "initialCost": {"land": 0, "buildings": 86564000},
      "gross": 98406000,
      "accumulatedDepreciation": 13236000
    }
    // 467 more rows
  ]
}
member is the raw XBRL member the filer chose to name that row, a real filer extension, not a StockFit identifier. locationMember rides along only when the filer crossed the property with a geography axis, which is not guaranteed, more on that below. Every value here originates in the filing itself: StockFit runs each 10-K through Arelle, the open-source XBRL processor, the same extraction pipeline behind the sibling Debt Tranche Structure API.
/api/footnotes/reit-properties requires the Professional plan. /api/financials/balance-sheet, the free-tier aggregate figure used as the on-ramp above, needs no paid plan at all.
EastGroup's industrial portfolio, mapped by state
Summing all 469 rows gives $6.7B in gross real estate value, filed 2026-02-11. That figure is directly checkable: SEC's own raw XBRL frames API returns the identical non-dimensional total for the same concept and period, $6.7B on the dollar, for the same filing (/api/filings/search-by-accession-number resolves the accession behind it). Net of $1.6B in accumulated depreciation, that is 94.2% of EGP's total balance-sheet assets, almost the entire company, which is exactly what you would expect from a pure-play industrial REIT.
Three states, Texas, Florida, and California, hold 71.6% of the portfolio's value. Texas alone accounts for 36.5% across 174 properties, more than the other 11 states combined. That concentration is not visible anywhere in EastGroup's balance sheet or income statement; it only exists in the per-property schedule.
How old is the portfolio: accumulated depreciation by state
Accumulated depreciation as a share of gross value is a rough vintage signal: a state where the buildings are mostly new shows a low percentage, a state EastGroup has owned property in for decades shows a high one. Portfolio-wide, 23.6% of EGP's gross real estate value has been depreciated so far.
The spread is wide. Louisiana is 67.4% depreciated, the oldest slice of the portfolio by a clear margin, followed by Mississippi at 63.4%. Tennessee sits at just 5.2%, consistent with recently acquired or newly built space in an expansion market. Neither state shows up as a standout in the first chart's dollar ranking, the vintage signal and the concentration signal are answering two different questions from the same schedule.
How filers tag Schedule III differently (and when the API returns nothing)
EastGroup tags one row per physical building, each crossed with a state member. Not every filer structures the schedule the same way. Ventas (VTR), a healthcare REIT, tags Schedule III at the operator level: one row can stand in for hundreds of buildings run by a single senior-living or medical-office operator, crossed only with a country member.
// From Ventas' FY2025 10-K, /api/footnotes/reit-properties?symbol=VTR
{
  "member": "vtr:AtriaSeniorLivingMember",
  "name": "Atria Senior Living",
  "locationMember": "country:US",
  "locationName": "United States",
  "gross": 5937530000,
  "accumulatedDepreciation": 2214975000,
  "improvements": 827971000
}
Iron Mountain (IRM), a records-and-data-storage REIT, goes the other direction: individual street addresses as far apart as Manassas, Virginia and Singapore, each its own row.
// From Iron Mountain's FY2025 10-K, /api/footnotes/reit-properties?symbol=IRM
{
  "member": "irm:A11660HaydenRoadManassasVirginiaMember",
  "name": "A 11660 Hayden Road Manassas Virginia",
  "locationMember": "country:US",
  "locationName": "United States",
  "gross": 2308707000,
  "accumulatedDepreciation": 132323000
}
member is a filer extension naming whatever asset that filer chose to disclose, an address, an operator portfolio, or sometimes just a named building with no geography at all. That flexibility is also the honest limit of this data: some large, well-known REITs disclose a real Schedule III in their 10-K and still return an empty array here, most often because their specific XBRL tagging does not cross the schedule with a recognizable per-property axis the same way EastGroup, Ventas, and Iron Mountain do. An empty response is not proof a REIT skips this disclosure, and a non-empty one is not automatically the filer's full schedule. Before building on any ticker, check that properties is non-empty and that dateFiled is recent, and where it matters, sum the rows and compare against the aggregate on /api/financials/balance-sheet, the same reconciliation used above for EastGroup. That same point-in-time discipline, verify against the filing rather than trust a normalized number, runs through the rest of StockFit's fundamentals data, and the same 10-K exhibit structure is covered more broadly in understanding SEC forms.
Schedule III is one footnote in a growing family. For the contracted revenue side of the same 10-K, not what a REIT owns but what it has already been promised, see the remaining performance obligation API.
FAQ
Q.What is SEC Schedule III and what does it disclose about a REIT's real estate?
Q.How do I get a REIT's per-property data via API?
/api/footnotes/reit-properties with a ticker, CIK, CUSIP, or FIGI and period=annual. The response returns one entry per fiscal year, each with a properties array holding every row the filer tagged: initial cost, carrying amount, gross value, and accumulated depreciation per property, plus a location member when the filer crossed the schedule with geography.Q.What is the difference between initial cost and carrying amount on a REIT's Schedule III?
Q.How can I tell how old a REIT's real estate portfolio is?
Q.Why do some REITs return no Schedule III data from the API?
properties array and a recent dateFiled before treating a response as complete for a given ticker.Q.Does Schedule III include property occupancy or rental income?
/api/footnotes/reit-properties.Q.How current is REIT Schedule III data?
dateFiled on each response reflects that filer's most recent annual report, not a rolling update. EastGroup Properties' FY2025 schedule used throughout this post was filed 2026-02-11, EastGroup Properties, Inc.'s (CIK 49600) most recent 10-K as of this writing.Q.Which StockFit plan includes the REIT property schedule API?
/api/footnotes/reit-properties requires the Professional plan ($99/mo, $69/mo billed annually), the same tier as the rest of the footnotes family (debt structure, stock compensation, leases, fair-value hierarchy). /api/financials/balance-sheet, the free-tier aggregate figure used as the reconciliation check in this post, requires no paid plan.Ready to build?
Free API key, no credit card.