How to Build a Stock Screener in Node.js
Build a stock screener in Node.js on sector-aware key metrics: one API call per company, filters for banks, insurers and REITs, and a small web UI.

The hard part of a stock screener is not the filtering. It is getting fundamental metrics that mean the same thing for every company, and knowing which ones apply at all. A free cash flow margin is a fine filter for a software company and meaningless for a bank. This tutorial builds a stock screener in Node.js on one endpoint that already knows the difference: key metrics returns 42 general metrics per company plus a set chosen for its sector and its industry, in a single request.
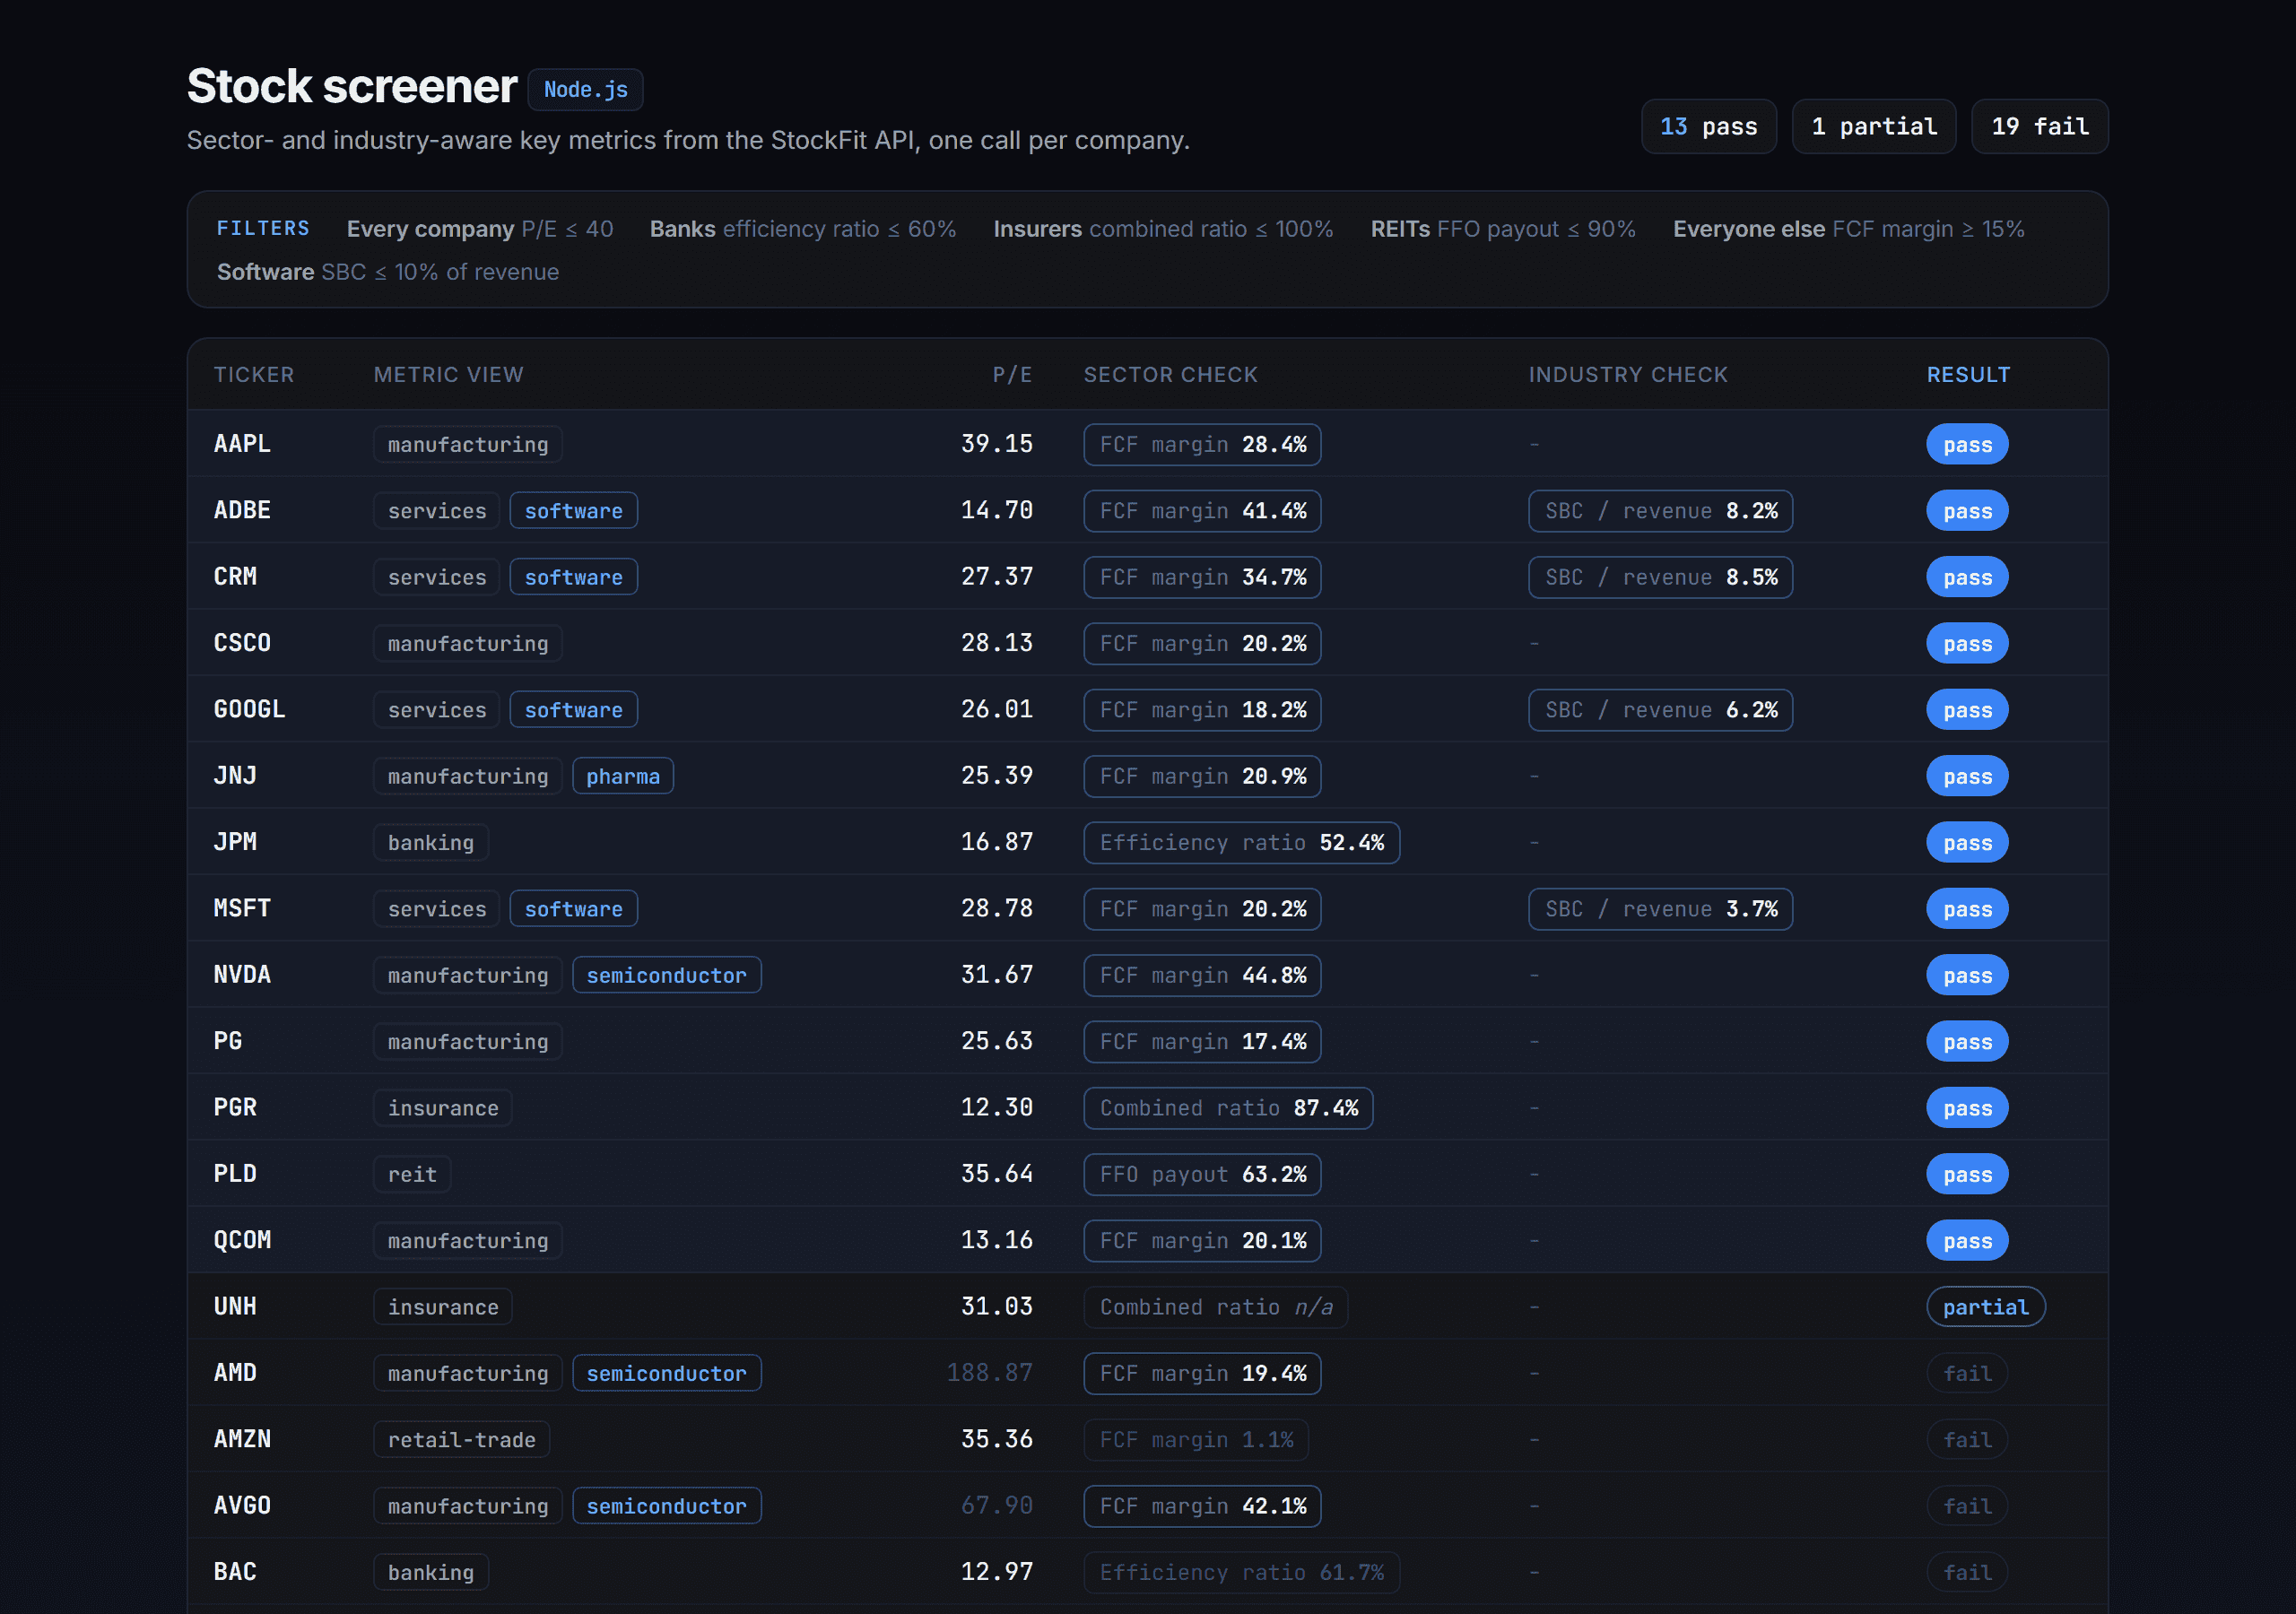
We built the app and ran it against the production API on 2026-11-17. Of the 33 stocks on the watchlist, 13 pass the example screen, 1 is missing a metric and 19 fail. The whole run is 34 requests. Node 18 or newer, and Express as the only dependency.
What a stock screener in Node.js needs
A custom stock screener is four small pieces: a list of tickers, the metrics for each one, the screening criteria, and a way to look at the result. Commercial screener APIs run all four behind one call, with their criteria. Building your own means you choose the rules, and with the right data API the metrics are the easy part. If you are evaluating a stock screener API for a product, this is the shape you would build on.
- Universe: a watchlist here, or every stock in a sector from /api/symbols.
- Metrics: one call per company to /api/financials/key-metrics, plus the latest close from /api/price/quote for P/E.
- Rules: a small config object, picked per sector and industry.
- UI: one Express route that returns JSON, one static HTML page.
This is not a real-time screener. Prices are delayed 15 minutes and fundamentals change when a company files, so the screen moves a few times a year, not tick by tick. Intraday price movements and volume scans need a real-time market data feed. This design is for traders and investors who filter stocks on the business.
Why key metrics: sector-aware metrics in one call
Here is Microsoft's FY2026 entry from the key metrics endpoint, trimmed to a few fields per block and rounded to two decimals:
{
  "period": "2026-06-30",
  "fiscalYear": 2026,
  "fiscalPeriod": "FY",
  "sector": "Services",
  "sectorId": "services",
  "industry": "Software Publishers",
  "industryId": "software",
  "general": {
    "revenue": 331839000000,
    "eps": 18,
    "grossMargin": 67.94,
    "operatingMargin": 46.78,
    "fcfMargin": 20.19,
    "roe": 34.04,
    "roic": 25.65,
    "debtToEquity": 0.07,
    "interestCoverage": 50.88,
    "dividendPayout": 19.77
  },
  "sectorMetrics": {
    "grossMargin": 67.94,
    "operatingMargin": 46.78,
    "ebitdaMargin": 62.68,
    "netMargin": 40.31,
    "sgaRevenue": 10.45,
    "roe": 34.04,
    "dso": 82.92
  },
  "industryMetrics": {
    "rdToRevenue": 10.72,
    "sbcToRevenue": 3.74,
    "fcfMargin": 20.19,
    "deferredRevenueGrowth": 13.03,
    "remainingPerformanceObligations": 684000000000
  }
}
Three blocks come back. general holds 42 financial ratios every company gets: margins, returns, leverage, free cash flow, coverage and per-share values. sectorMetrics holds the metrics for the company's sector view, and industryMetrics adds a set for specialized industries, here software: R&D and stock-based compensation as a share of revenue, deferred revenue growth and remaining performance obligations. That is what saves the most work. Microsoft's 10-K has no line called "SBC to revenue"; someone has to find both inputs, line them up by period and divide. The endpoint did that for every company on the list.
The sector view is where it pays off for screening. The same call for a bank, an insurer and a REIT returns different metrics, because those businesses are judged on different numbers:
{
  "JPM (banking)": {
    "nim": 2.26,
    "efficiencyRatio": 52.42,
    "roe": 16.13,
    "roa": 1.35,
    "loanToDeposit": 0.57,
    "provisionToLoans": 1.02
  },
  "PGR (insurance)": {
    "lossRatio": 66.08,
    "expenseRatio": 21.34,
    "combinedRatio": 87.42,
    "roe": 40.45,
    "premiumGrowth": 15.34
  },
  "O (reit)": {
    "ffo": 3582790000,
    "affo": 3450990000,
    "ffoPerShare": 3.84,
    "payoutRatio": 81.53,
    "debtToAssets": 35.14
  }
}
A bank gets net interest margin and its efficiency ratio. An insurer gets the loss, expense and combined ratios. A REIT gets funds from operations and its payout of FFO, the numbers REIT investors actually use. There are 13 sector views and 8 industry views (software, semiconductors, pharma, aerospace, automotive, airlines, oil and gas, fintech), and the full catalog with every formula is in the endpoint's schema. Our post on sector and industry metrics shows what a one-size screen loses without them: about 430 S&P 500 rows on gross margin, not 500.
A few more things make it easy to build on. Units are consistent: margins come back as percent values (20.19 means 20.19%) and ratios as decimals. null means the input was not reported or a divisor was zero, never a silent zero. period takes annual, quarter or ttm, and currency converts foreign filers. The endpoint is on the Starter plan and up, and every free account includes 50 premium calls, enough to on its 33 stocks.
Step 1: Set up the project and the API client
mkdir stock-screener && cd stock-screener
npm init -y && npm pkg set type=module
npm install express          # or: yarn add express
export STOCKFIT_API_KEY=your_api_key
The client is the only part that touches the network. It sends the API key as a Bearer token, caps concurrent requests, waits as long as a 429's Retry-After header asks, and caches each response on disk for a day. Annual metrics change once a year per company, so a rerun of the screen costs nothing.
// lib/stockfit-client.js
import {createHash} from 'node:crypto';
import fs from 'node:fs/promises';
import path from 'node:path';

const BASE_URL = 'https://api.stockfit.io/v1';
const sleep = (ms) => new Promise((resolve) => setTimeout(resolve, ms));

export class StockFitClient {
    constructor({apiKey, cacheDir = '.cache', maxConcurrent = 4, cacheTtlHours = 24}) {
        if (!apiKey) {
            throw new Error('Set STOCKFIT_API_KEY');
        }
        this.apiKey = apiKey;
        this.cacheDir = cacheDir;
        this.cacheTtlMs = cacheTtlHours * 3_600_000;
        this.maxConcurrent = maxConcurrent;
        this.active = 0;
        this.waiting = [];
    }

    async get(endpoint, params = {}) {
        const url = new URL(`${BASE_URL}${endpoint}?${new URLSearchParams(params)}`);
        const cached = await this.readCache(url);
        if (cached !== undefined) {
            return cached;
        }
        const body = await this.withSlot(() => this.fetchJson(url));
        await this.writeCache(url, body);
        return body;
    }

    async fetchJson(url, attempt = 1) {
        const res = await fetch(url, {headers: {Authorization: `Bearer ${this.apiKey}`}});
        if (res.status === 429 && attempt <= 3) {
            await sleep(Number(res.headers.get('retry-after') ?? 60) * 1000);
            return this.fetchJson(url, attempt + 1);
        }
        if (!res.ok) {
            throw new Error(`${res.status} on ${url.pathname}${url.search}: ${await res.text()}`);
        }
        return res.json();
    }

    async withSlot(task) {
        while (this.active >= this.maxConcurrent) {
            await new Promise((resolve) => this.waiting.push(resolve));
        }
        this.active++;
        try {
            return await task();
        } finally {
            this.active--;
            this.waiting.shift()?.();
        }
    }

    cacheFile(url) {
        const key = createHash('sha1').update(url.pathname + url.search).digest('hex');
        return path.join(this.cacheDir, `${key}.json`);
    }

    async readCache(url) {
        try {
            const {savedAt, body} = JSON.parse(await fs.readFile(this.cacheFile(url), 'utf8'));
            return Date.now() - savedAt < this.cacheTtlMs ? body : undefined;
        } catch (err) {
            if (err.code !== 'ENOENT') {
                console.warn(`Ignoring unreadable cache entry for ${url.pathname}: ${err.message}`);
            }
            return undefined;
        }
    }

    async writeCache(url, body) {
        await fs.mkdir(this.cacheDir, {recursive: true});
        await fs.writeFile(this.cacheFile(url), JSON.stringify({savedAt: Date.now(), body}));
    }
}
The universe is 33 tickers, picked so the sector views show up: big tech, consumer staples, industrials, energy, three banks, two insurers and two REITs. A screen tested only on software companies will never tell you it mishandles a bank.
// watchlist.js
export const WATCHLIST = [
    'AAPL', 'MSFT', 'NVDA', 'GOOGL', 'META', 'AMZN', 'AVGO', 'ADBE', 'CRM', 'ORCL', 'CSCO', 'INTC', 'AMD', 'QCOM', 'TXN',
    'COST', 'WMT', 'KO', 'PEP', 'PG', 'JNJ', 'UNH', 'CAT', 'DE', 'HON', 'SLB', 'CVX',
    'JPM', 'BAC', 'GS', 'PGR', 'O', 'PLD',
];
Step 2: Fetch key metrics and quotes with async/await
One key metrics request per company, all in parallel through the client's concurrency cap, and one quote request for up to 50 tickers. P/E is the close divided by EPS from the general block.
// lib/screener.js
import {screen} from './rules.js';

export class StockScreener {
    constructor(client, {quoteBatchSize = 50} = {}) {
        this.client = client;
        this.quoteBatchSize = quoteBatchSize;
    }

    async quotes(tickers) {
        const quotes = {};
        for (let i = 0; i < tickers.length; i += this.quoteBatchSize) {
            const symbols = tickers.slice(i, i + this.quoteBatchSize).join(',');
            Object.assign(quotes, await this.client.get('/api/price/quote', {symbols}));
        }
        return quotes;
    }

    async run(tickers) {
        const [quotes, settled] = await Promise.all([
            this.quotes(tickers),
            Promise.allSettled(tickers.map((symbol) => this.client.get('/api/financials/key-metrics', {symbol, period: 'annual', limit: 1}))),
        ]);
        return tickers.map((symbol, i) => {
            const [company] = settled[i].value ?? [];
            if (!company) {
                return {symbol, error: settled[i].reason?.message ?? 'No annual key metrics'};
            }
            const price = quotes[symbol]?.close;
            const eps = company.general.eps;
            company.lossMaking = Number.isFinite(eps) && eps <= 0;
            company.pe = eps > 0 && price > 0 ? price / eps : null;
            return {symbol, ...company, ...screen(company)};
        });
    }
}
That is 34 requests for 33 stocks. Promise.allSettled means one bad ticker shows up as a row with an error instead of failing the run. Batched quotes need a paid plan; on the Free plan, construct the screener with {quoteBatchSize: 1}.
Step 3: Sector- and industry-aware filters
The rules are a config object. Every company gets a P/E cap. Then each sector view brings one rule that fits it, everyone else gets a free cash flow margin floor, and software companies get one industry rule on top. These are examples of specific criteria, not a list of undervalued stocks, and not advice.
// lib/rules.js
// Example criteria, not advice. Percent metrics are percent values (15 means 15%), as the API returns them.
const EVERY_COMPANY = [{label: 'P/E', path: 'pe', op: '<=', value: 40, unit: 'x'}];

const BY_SECTOR = {
    banking: [{label: 'Efficiency ratio', path: 'sectorMetrics.efficiencyRatio', op: '<=', value: 60, unit: '%'}],
    insurance: [{label: 'Combined ratio', path: 'sectorMetrics.combinedRatio', op: '<=', value: 100, unit: '%'}],
    reit: [{label: 'FFO payout', path: 'sectorMetrics.payoutRatio', op: '<=', value: 90, unit: '%'}],
    default: [{label: 'FCF margin', path: 'general.fcfMargin', op: '>=', value: 15, unit: '%'}],
};

const BY_INDUSTRY = {
    software: [{label: 'SBC / revenue', path: 'industryMetrics.sbcToRevenue', op: '<=', value: 10, unit: '%'}],
};

export function rulesFor(company) {
    return [...EVERY_COMPANY, ...(BY_SECTOR[company.sectorId] ?? BY_SECTOR.default), ...(BY_INDUSTRY[company.industryId] ?? [])];
}

const read = (company, path) => path.split('.').reduce((obj, key) => obj?.[key], company);

// A loss fails the P/E rule (a negative P/E would pass "<= 40"). A missing metric is 'na':
// never compare null directly, in JavaScript `null <= 1` is true.
function check(company, rule) {
    if (rule.path === 'pe' && company.lossMaking) {
        return {...rule, actual: null, result: 'fail'};
    }
    const actual = read(company, rule.path);
    if (actual === null || actual === undefined) {
        return {...rule, actual: null, result: 'na'};
    }
    const passed = rule.op === '>=' ? actual >= rule.value : actual <= rule.value;
    return {...rule, actual, result: passed ? 'pass' : 'fail'};
}

export function screen(company) {
    const checks = rulesFor(company).map((rule) => check(company, rule));
    const results = checks.map((c) => c.result);
    const verdict = results.includes('fail') ? 'fail' : results.includes('na') ? 'partial' : 'pass';
    return {checks, verdict};
}
In our run, JPMorgan passes with an efficiency ratio of 52.4%, while Bank of America (61.7%) and Goldman Sachs (64.4%) fail. Progressive passes with a combined ratio of 87.4%, meaning it made an underwriting profit. Meta clears the P/E and free cash flow rules but fails the software rule: stock-based compensation was 10.2% of revenue. None of those checks needed a formula on our side.
Adding a rule is one line. Realty Income fails the P/E cap at 50.0x, which says little about a REIT, since depreciation depresses its earnings. The REIT view already carries ffoPerShare, so a price-to-FFO rule for REITs is a single entry in BY_SECTOR.reit.
The null trap: why null <= 1 lets banks through
Sector awareness also means the general block is honest about what does not apply. For JPMorgan it returns:
const jpm = {
    "grossMargin": null,
    "operatingMargin": null,
    "debtToEquity": null,
    "freeCashFlow": null,
    "fcfMargin": null
};

jpm.debtToEquity <= 1       // true: null is coerced to 0, so the bank passes a leverage filter
jpm.fcfMargin >= 15         // false: and silently fails a cash filter
eps <= 0 && price / eps <= 40   // true: a loss-maker's negative P/E passes "P/E <= 40"
JavaScript coerces null to 0 in a comparison, so the same missing value passes a <= filter and fails a >= filter, with no error. That is why check tests for null first and returns a third outcome, na, and why a company with a missing metric shows up as partial rather than slipping through. UnitedHealth is the one partial in our run: its insurance view reports a loss ratio of 89.15% but no expense or combined ratio. The loss case is the cousin of the same bug, and the rules treat a loss as a P/E failure rather than computing a negative ratio.
Step 4: A small web UI with Express
The backend is one route and the frontend is one static page, no framework and no build step.
// server.js
import express from 'express';
import {StockFitClient} from './lib/stockfit-client.js';
import {StockScreener} from './lib/screener.js';
import {WATCHLIST} from './watchlist.js';

const screener = new StockScreener(new StockFitClient({apiKey: process.env.STOCKFIT_API_KEY}));
const app = express();
app.use(express.static('public'));

app.get('/api/screen', async (req, res) => {
    try {
        res.json(await screener.run(WATCHLIST));
    } catch (err) {
        console.error('Screen failed:', err);
        res.status(502).json({error: err.message});
    }
});

app.listen(3030, () => console.log('Screener on http://localhost:3030'));
The page fetches /api/screen, renders the table and sorts on a header click, about 75 lines of script. Each check renders as a chip with its label and value, so a row shows which rule it was judged on. Company data comes from public filings, so text is escaped before it goes into innerHTML. Run node server.js, open localhost:3030, and you get the screen at the top of this post.
Custom metrics and your own formulas
Key metrics covers most screens. You need something else when the definition matters to you, when the metric is not in the catalog, or when you backtest. The fix in each case is to compute from the financial statements, and the API serves the same normalized line items key metrics is built from.
When the definition matters. Key metrics documents every formula, and you may want a different one. Its debt to equity is long-term debt over equity, 0.07 for Microsoft. Count the current portion of debt (totalBorrowings) and it is 0.09. Count operating and finance leases too (totalDebt) and it is 0.29. All three are honest; pick the one that fits your screen. The balance sheet from /api/financials/balance-sheet has every input, as do /api/financials/income-statement and /api/financials/cash-flow-statement.
When the metric is not there. The statements cover the curated line items, and /api/financials/as-reported returns every concept a company filed, including its own extensions. Each statement value also carries the accession number of the filing it came from, so a custom metric keeps its receipt: Microsoft's FY2026 figures trace to 10-K 0001193125-26-323660.
When you backtest. A screen run on today's numbers tells you nothing about what it would have picked in 2020, because some of those numbers were restated later. Statement rows carry the original filing date, and every later filing that changed a value keeps the earlier value as before. Plug Power's FY2018 net loss reads $85.6M today, but that figure arrived in a 10-K filed on 2021-05-14; until then the public number was $78.1M. Our guide to point-in-time data for backtesting covers how to rebuild what was known on any date.
The trade-off is work: three statement calls per company instead of one, your own formulas, and your own handling of every edge case key metrics already handles, such as the bank with no capex line. A good pattern is to screen on key metrics and pull statements only for the short list, for example to build a valuation like our DCF model tutorial does. Our stock screener in Python takes the statement route end to end, on the Free plan.
From watchlist to thousands of stocks
The screener does not care where the tickers come from. /api/symbols filters by sector, so a whole sector of several hundred stocks replaces the watchlist with no other change. The budget stays simple: one key metrics call per company and one quote call per 50. A few things help at that size.
- Cache by filing. Annual metrics only change when a company files a 10-K. Keep them until the fiscal year in the response moves, and refresh only prices daily.
- Use ttm for fresher screens.
period=ttmsums the last four quarters, so the screen moves every quarter instead of every year. - Rank, then export. Filters return a set. Sort the passing stocks by a score, for example free cash flow margin, and write a CSV.
For how the fundamentals compare across providers, see the best fundamentals APIs compared, and to check any figure against the source filing, EDGAR full-text search finds it. The data is not investment advice.
FAQ
Q.How do I build a stock screener in Node.js?
Q.What are sector-aware key metrics?
Q.Is there a free API for building a stock screener?
Q.Why does my JavaScript stock screener let banks pass a debt-to-equity filter?
null <= 1 is true because null is coerced to 0. The same null fails a >= filter. Test for null before comparing, return a third "not available" outcome, and judge banks on bank metrics such as the efficiency ratio instead.Q.How do I screen with my own formulas?
Q.How many API calls does a stock screener need?
Q.Can a stock screener use real-time data?
Ready to build?
Free API key, no credit card.