Sector Metrics: StockFit vs Financial Modeling Prep
Why a single key-metrics shape fails for banks, insurers, and REITs, and how StockFit returns the right metrics for each business model.
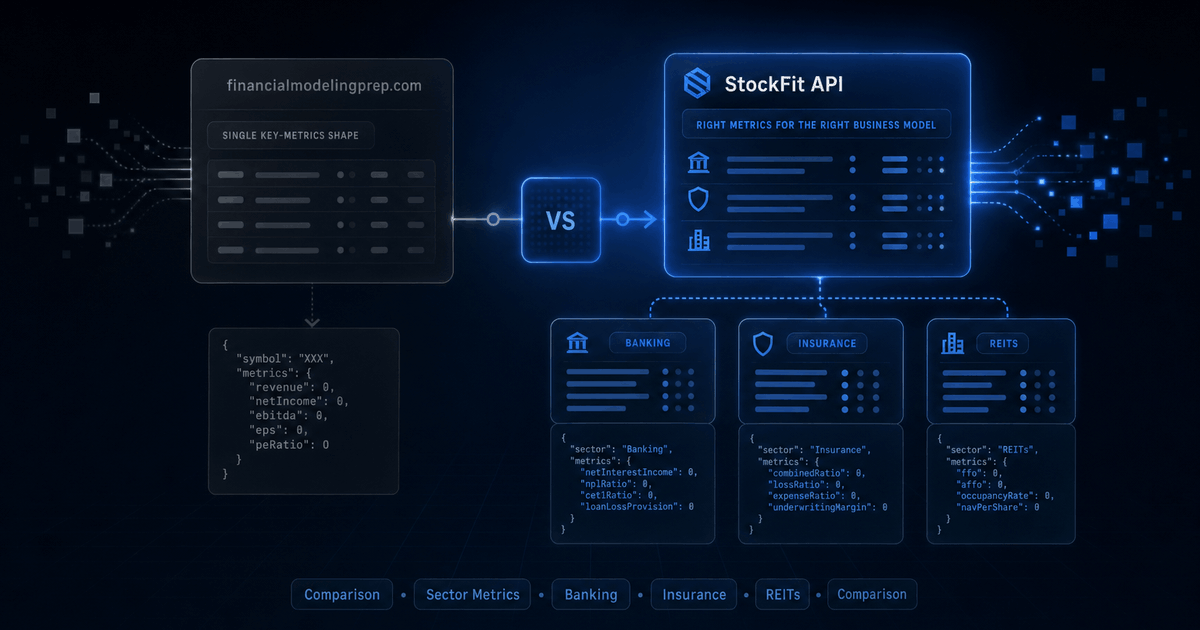
A bank does not report a gross margin. An insurance company does not have inventory to turn over. A REIT's GAAP earnings-per-share understates the cash it actually generates — the industry compares REITs on FFO/share instead. Most general-purpose financial-data APIs return a single, identically-shaped key-metrics response for every company in the universe, and the mismatch shows up as null in the rows that matter most.
This post compares how StockFit and financialmodelingprep.com (FMP) handle sector- and industry-specific metrics. Every StockFit response below is a real, just-pulled call against our production API. Every FMP claim links back to their published documentation; where their docs don't cover something, we say so rather than guess. For the wider field of vendors, see our roundup of the best fundamentals APIs.
The problem with one-shape-fits-all metrics
Run this thought experiment. You write a Node.js screen that ranks the entire S&P 500 by grossMargin using whatever financial-data API you have. You expect 500 rows. Instead you get ~430. The missing 70 are the banks, insurers, and REITs — the financial sector and real estate are 30% of the index by count, and they all return null for gross margin. Same for current ratio, inventory turnover, days sales outstanding, and most balance-sheet leverage metrics designed for industrial companies.
That isn't a bug in the data. JPMorgan's 10-K doesn't report a cost-of-revenue line because banks don't sell goods — they take deposits and make loans. The right operating metric for a bank is net interest margin, the spread between interest earned on assets and interest paid on liabilities. But if your API returns the same set of fields for a bank as for a software company, you never see it.
Below is a real call against StockFit's key-metrics endpoint for JPMorgan (JPM). The general-purpose ratios mostly come back null — banks don't use them — but the sector-specific tier returns the metrics that actually matter for a bank:
{
  "period":     "2025-12-31",
  "sector":     "Finance/Insurance/Real Estate",
  "sectorId":   "banking",
  "industry":   "National Commercial Banks",
  "general": {
    "revenue":          182447000000,
    "netIncome":         57048000000,
    "grossMargin":       null,            // banks don't report cost-of-revenue (interest expense lives in a different framework)
    "currentRatio":      null,            // banks present an unclassified balance sheet under ASC 942
    "inventoryTurnover": null,            // banks carry trading securities and loans, not merchandise inventory
    "roa":               1.354,
    "roe":              16.134,
    "eps":              20.05
    // ... ~30 more general fields
  },
  "sectorMetrics": {
    "netInterestIncome":  28032000000,
    "interestIncome":     28032000000,
    "nim":                  0.665,        // net interest margin %
    "loanToDeposit":        0.573,
    "efficiencyRatio":     83.139,
    "provisionToLoans":     1.018
  },
  "industryMetrics": {}
}
That's the actual response shape: three tiers stacked in the same JSON. general for the metrics every company has, sectorMetrics for the ones tied to the company's broad business model, and industryMetrics for granular industry KPIs (more on that below).
The three-tier metric model
/api/financials/key-metrics classifies every company by SIC code into a sector and (for specialized industries) an industry. Three layers of metrics get computed and returned in a single response:
| Tier | Applies to | What it covers | Example fields |
|---|---|---|---|
| general | Every company | Profitability, returns, leverage, liquidity, turnover, per-share, cash flow — a superset of the traditional ratio universe. | ~50 fields including profitMargin, roa, roe, roic, debtToEquity, fcfMargin, revenuePerShare, bookValuePerShare |
| sectorMetrics | Companies in the company's broad sector | Metrics specific to the business model: NIM for banks, combined ratio for insurers, FFO for REITs, inventory turnover for retail, etc. | Varies by sector (see table below). |
| industryMetrics | Companies in a recognized specialized industry (semiconductors, software, pharma, airlines, etc.) | Granular KPIs that matter inside an industry but not across it. | Varies by industry (see table below). |
Sectors with dedicated metric sets
Mapped from SIC codes. Every sector below has a complete sectorMetrics implementation in our codebase that we've verified end-to-end against real filings:
| Sector | Sector-specific fields returned | Why these matter |
|---|---|---|
| Banking | netInterestIncome, interestIncome, interestExpense, nim, loanToDeposit, efficiencyRatio, provisionToLoans, sector-specific roa / roe | Banks earn on a spread, not a margin. NIM is the spread; loan-to-deposit shows funding mix; efficiency ratio is bank-equivalent of opex/revenue. |
| Insurance | lossRatio, expenseRatio, combinedRatio, underwritingIncome, investmentIncome, premiumGrowth, floatYield, floatSize, dacRatio, reserveRatio, insuranceLeverage, bookValueGrowth | P&C insurers are profitable iff combined ratio < 100%. Float is the investable capital insurers earn on between premium and claim — Buffett's favourite metric. |
| REIT | ffo, affo, ffoPerShare, payoutRatio (dividends/FFO), debtToAssets, interestCoverage | GAAP earnings under-state REIT cash generation because of large non-cash D&A on real estate. FFO and AFFO are the industry-standard cash measures. |
| Manufacturing | inventoryTurnover, daysInventory, dso, dpo, ccc (cash conversion cycle), capexRevenue, capexDepreciation, warrantyReserve | Working-capital efficiency and capex intensity are the operating signals for industrials. |
| Retail Trade | inventoryTurnover, daysInventory, inventoryToRevenue | Retail succeeds on inventory velocity; days-inventory directly drives the cash cycle. |
| Wholesale | inventoryTurnover, dsoDays, dpoDays, cccDays, assetTurnover | Distributors live and die on the cash cycle. |
| Utilities | operatingMargin, dividendPayout, capexToRevenue, capexToDepreciation, debtToEquity, interestCoverage | Regulated, capex-heavy, debt-funded, dividend-paying — the metrics reflect that. |
| Telecom | ebitdaMargin, fcf, fcfToRevenue, capexToRevenue, debtToEbitda | Telecom is EBITDA-and-capex driven; debt/EBITDA is the standard leverage measure. |
| Transportation | operatingRatio, assetTurnover, capexToRevenue, capexToDepreciation, fcf, debtToEquity | Operating ratio is the railroad/trucking industry's headline efficiency metric. |
| Mining | ebitdaMargin, fcfMargin, capexToDda, debtToEquity, interestCoverage | Cyclical, capital-intensive — EBITDA and capex coverage of D&A are the through-cycle signals. |
| Construction | netMargin, dsoDays, dpoDays, debtToEquity, interestCoverage | Receivables timing dominates cash flow; project leverage matters for solvency. |
| Agriculture | inventoryTurnover, daysInventory, debtToEquity, interestCoverage, capexToDepreciation | Crop-cycle inventory + land-financed leverage. |
| Services | ebitdaMargin, sgaToRevenue | Asset-light service businesses: SG&A intensity is the lever. |
Industries with extra granular metrics
Layered on top of the sector tier when the company maps to a specialized industry. A semiconductor company gets manufacturing's sectorMetrics plus semiconductor's industryMetrics:
| Industry | Industry-specific fields | Why these matter |
|---|---|---|
| Semiconductor | rdToRevenue, sbcToRevenue, fcfConversion, fcfMargin | R&D intensity drives the next product cycle; SBC is large for chip companies; FCF/NI separates real cash from accounting noise. |
| Software | rdToRevenue, sgaToRevenue, sbcToRevenue, deferredRevenue, deferredRevenueGrowth, billings (proxy) | Subscription businesses lead with bookings/billings, not just revenue; deferred revenue growth is forward demand. |
| Pharma & Biotech | rdToRevenue, sbcToRevenue, cashRunwayQuarters | For pre-revenue biotechs, runway is the survival metric. |
| Aerospace & Defense | fcfConversion, daToRevenue, debtToEbitda, interestCoverage, rdToRevenue | Long-cycle programs, large D&A, capital structure matters. |
| Automotive | rdToRevenue, capexToDepreciation, inventoryTurnover, debtToEquity | Capex intensity, model-cycle R&D, dealer/factory inventory. |
| Airlines | ebitdaMargin, debtToEbitda, capexToRevenue, interestCoverage | Operationally leveraged + heavily debt-funded; coverage ratios drive credit. |
| Oil & Gas | ebitdaMargin, capexToRevenue, debtToEbitda, dividendPayout | Cyclical commodity producer — through-cycle debt and shareholder return are the focus. |
| Fintech & Payments | grossMargin, rdToRevenue, sgaToRevenue, sbcToRevenue | High-growth software-economics metrics adapted to payments. |
How it's calculated
Three pieces fit together:
- SIC → sector and industry classification. Every company filed with the SEC has a SIC code in their submissions metadata. We map ranges to sector IDs (banking, insurance, REIT, etc.) and prefix-match a smaller set of high-value SIC codes to industry IDs (semiconductor, software, pharma, etc.). The classifier is deterministic and inspectable — it's a pure function in
shared/src/utils/sector.ts. - Per-fact applicability tagging. Each curated fact in our catalogue is annotated with the sectors/industries it applies to.
premiumsEarnedis tagged[insurance];noninterestIncomeis tagged[banking];provisionForCreditLossesis tagged[banking]. This drives both fact mapping during ingest and the optionalincludeMissingFactsflag on /api/financials/income-statement — you only get N/A keys for facts your company's sector actually uses. - Per-sector metric formulas. Each sector has a registered “view” with a list of metric definitions. A view's formula references curated fact names (
netIncome,operatingCashFlow,capitalExpenditure, etc.) and produces a numeric output. For a REIT, the FFO formula isnetIncome + D&A; for a bank, NIM isnetInterestIncome / averageLoans. The formulas are visible in the codebase undershared/src/types/performance-views.ts.
key-metrics endpoint pick it up automatically. Recently shipped: REIT FFO/AFFO support for the full SIC 6798 universe (~190 companies including PLD, AMT, EQIX, CCI, SPG, AVB, EQR).Real responses across business models
To make this concrete, here's what the same endpoint returns for four very different companies. Every value below is a live API response, just-pulled.
Insurance: Progressive (PGR)
{
  "period":     "2025-12-31",
  "sector":     "Finance/Insurance/Real Estate",
  "sectorId":   "insurance",
  "industry":   "Direct Property and Casualty Insurance Carriers",
  "general":    { "revenue": 87671000000, "netIncome": 11308000000, "eps": 19.29, "...": "..." },
  "sectorMetrics": {
    "lossRatio":         53.04,           // claims / earned premiums
    "expenseRatio":       7.47,           // underwriting opex / earned premiums
    "combinedRatio":     60.50,           // < 100% = underwriting profit
    "underwritingIncome": 32255000000,
    "investmentIncome":    3549000000,
    "premiumGrowth":      15.34,          // YoY
    "floatYield":          4.00,          // investment income / float
    "floatSize":         43310000000,     // investable capital between premium and claim
    "dacRatio":            2.50,
    "reserveRatio":        0.53,
    "bookValueGrowth":    18.49
  },
  "industryMetrics": {}
}
A combined ratio of 60.5% means Progressive is making 39.5 cents of underwriting profit on every premium dollar — before they even invest the float. That's why PGR has compounded book value at 18%/year. None of this would be visible from a generic key-metrics shape that only returns ROE and debt/equity.
REIT: Prologis (PLD)
{
  "period":     "2025-12-31",
  "sector":     "Finance/Insurance/Real Estate",
  "sectorId":   "reit",
  "industry":   "Real Estate Investment Trusts",
  "general":    { "revenue": 8790127000, "netIncome": 3328231000, "eps": 3.58, "...": "..." },
  "sectorMetrics": {
    "ffo":              5954259000,       // FFO = Net Income + D&A
    "affo":             5954259000,       // AFFO = FFO + capex (capex null here)
    "ffoPerShare":            6.41,       // REIT-equivalent of EPS
    "payoutRatio":          63.23,        // dividends / FFO (REITs must pay 90%+ of taxable income)
    "debtToAssets":         36.04,
    "interestCoverage":      4.35
  },
  "industryMetrics": {}
}
PLD's GAAP EPS of $3.58 dramatically understates cash generation because of $2.6B in real-estate D&A that isn't a real cash cost. FFO/share of $6.41 is the right figure to compare across REITs. AMT, EQIX, CCI, SPG, AVB, and the rest of the major US REIT universe all return the same set of fields.
Semiconductor: NVIDIA (NVDA) — sector + industry tiers
{
  "period":     "2026-01-31",
  "sector":     "Manufacturing",
  "sectorId":   "manufacturing",
  "industry":   "Semiconductor and Related Device Mfg.",
  "industryId": "semiconductor",
  "general":    { "revenue": 215938000000, "netIncome": 120067000000, "eps": 4.93, "...": "..." },
  "sectorMetrics": {
    "inventoryTurnover":     3.97,
    "daysInventory":        91.97,
    "grossMargin":          71.07,
    "operatingMargin":      60.38,
    "dso":                  52.00,
    "dpo":                  47.10,
    "ccc":                  96.87,        // cash conversion cycle, days
    "capexRevenue":          5.92,
    "capexDepreciation":     4.50,
    "assetTurnover":         1.36
  },
  "industryMetrics": {
    "rdToRevenue":           8.57,        // % of revenue spent on R&D
    "sbcToRevenue":          2.96,        // stock-based comp as % revenue
    "fcfConversion":         0.75,        // free cash flow / net income
    "fcfMargin":            41.65
  }
}
Notice both tiers populated. sectorMetrics handles the “NVIDIA-as-manufacturer” lens (working capital, capex). industryMetrics adds the semi-specific signals (R&D intensity, SBC, FCF conversion). Generic key-metrics endpoints typically expose neither. For the full company picture behind these numbers (revenue trajectory, moats, capital allocation, peer landscape), see NVIDIA Corp (NVDA): The AI Infrastructure Colossus.
Comparison: StockFit vs financialmodelingprep.com
What we know about FMP comes from their public docs. They have well-documented endpoints for general key metrics and ratios; we couldn't find public documentation for sector-specific endpoints (NIM for banks, combined ratio for insurers, FFO for REITs). If they exist and we missed them, please point us at the URL.
| Capability | StockFit API | financialmodelingprep.com (FMP) |
|---|---|---|
| Generic key metrics (revenue, EPS, ROE, ROA, debt/equity, P/E, etc.) | ~50 fields under general in /api/financials/key-metrics. | Yes — Key Metrics endpoint, similar set of fields. |
| Banking-specific metrics (NIM, loan/deposit, efficiency ratio, provision ratios) | Yes — returned automatically when sectorId: "banking". | Not documented in their public Key Metrics or Ratios endpoint. Could not find a banking-specific endpoint. |
| Insurance-specific metrics (combined ratio, loss/expense ratio, float yield, premium growth) | Yes — returned automatically when sectorId: "insurance". | Not documented publicly. |
| REIT-specific metrics (FFO, AFFO, FFO per share, payout ratio) | Yes — returned automatically when sectorId: "reit" (covers full SIC 6798 universe). | Not documented publicly. |
| Industry-specific layer (semiconductor R&D intensity, software billings, pharma cash runway, etc.) | Yes — industryMetrics populated when company maps to a recognized industry. | Not documented as a separate tier. |
| Sector P/E aggregates | Not offered as a separate endpoint today. | Yes — Sector P/E Snapshot and historical sector P/E. |
| Stock screener with sector/industry filter | Build it client-side via /api/symbols + /api/financials/key-metrics. | Yes — built-in stock screener with sector/industry filter parameters. |
| Free tier | — no credit card; rate-limited. | 250 API requests/day on the free plan; bandwidth-limited at 500MB/30 days. |
| Entry paid plan | $15/mo Starter. | $19/mo Starter (per their public pricing page). |
| Mid plan | $39/mo Stock or ETF. | $69/mo Premium. |
| Top published plan | $69/mo Professional. | $139/mo Ultimate. |
What problems this solves
1. Bank-only quality screen
You want to rank US banks by “quality”: high NIM, low efficiency ratio, low provision/loans. With a generic API you'd have to compute these yourself by reverse-engineering the income statement. With StockFit you fetch key-metrics and read sectorMetrics.nim, sectorMetrics.efficiencyRatio, sectorMetrics.provisionToLoans directly.
2. Insurance underwriting screen
P&C insurers are profitable iff combined ratio is below 100%. Sort by trailing combined ratio, exclude any insurer above 100%, rank by float yield. Three reads from one API call per company.
3. REIT comparable-company analysis
Comparing REITs on EPS is wrong because of large non-cash D&A on real estate. Compare on ffoPerShare and payoutRatio. The full US REIT universe (~190 companies in our data) is comparable on these fields out of the box. To pull the right REIT comparison set in the first place, the Company Peers API sub-sectors REITs (residential, retail, office, healthcare, and more) rather than lumping them together.
4. Software-business cohort tracking
For SaaS-style businesses, pull industryMetrics.deferredRevenueGrowth as a forward-demand signal alongside trailing industryMetrics.billings. These don't exist for non-software companies and aren't in a generic ratios endpoint.
Tutorial: build a sector-aware screen in Node.js
The example below pulls a small universe, fetches sector-aware key metrics for each, and produces three separate ranked lists: best banks by efficiency, best insurers by combined ratio, best REITs by FFO yield. About 60 lines.
Step 1 — auth boilerplate
# Get a free API key (no credit card)
open https://developer.stockfit.io/signup
export STOCKFIT_KEY="your_token"
Step 2 — the screen
const KEY = process.env.STOCKFIT_KEY;
const BASE = 'https://api.stockfit.io/v1/api';
const headers = { Authorization: `Bearer ${KEY}` };

const get = async (path, params = {}) => {
  const url = new URL(BASE + path);
  for (const [k, v] of Object.entries(params)) url.searchParams.set(k, v);
  const r = await fetch(url, { headers });
  if (!r.ok) throw new Error(`${r.status} ${url}`);
  return r.json();
};

// Pull most recent annual key-metrics for one symbol
async function metrics(symbol) {
  const rows = await get('/financials/key-metrics', {
    symbol, period: 'annual', limit: 1,
  });
  return rows[0]; // { period, sector, sectorId, industry, industryId, general, sectorMetrics, industryMetrics }
}

const universe = [
  // Banks
  'JPM', 'BAC', 'WFC', 'C', 'GS', 'MS', 'USB', 'PNC', 'TFC', 'COF',
  // Insurers
  'PGR', 'TRV', 'ALL', 'AIG', 'CB', 'HIG', 'WRB', 'CINF', 'AFG', 'MKL',
  // REITs
  'PLD', 'AMT', 'EQIX', 'WELL', 'CCI', 'SPG', 'O', 'AVB', 'EQR', 'PSA',
];

const data = await Promise.all(universe.map(async s => {
  try { return { symbol: s, ...(await metrics(s)) }; }
  catch (e) { return { symbol: s, error: e.message }; }
}));

// Helper: real-world filter — values must be present and within sensible bounds
const within = (v, lo, hi) => v != null && v >= lo && v <= hi;

// 1. Banks by efficiency ratio (lower is better; sensible band 30–90%)
const banks = data
  .filter(d => d.sectorId === 'banking' && within(d.sectorMetrics?.efficiencyRatio, 30, 90))
  .sort((a, b) => a.sectorMetrics.efficiencyRatio - b.sectorMetrics.efficiencyRatio)
  .slice(0, 5)
  .map(d => ({
    symbol: d.symbol,
    nim: d.sectorMetrics.nim?.toFixed(2),
    efficiency: d.sectorMetrics.efficiencyRatio?.toFixed(1),
    loanToDeposit: d.sectorMetrics.loanToDeposit?.toFixed(2),
  }));
console.log('\nTop banks by efficiency ratio:');
console.table(banks);

// 2. Insurers by combined ratio (sensible band 40–110%; below 100% = underwriting profit)
const insurers = data
  .filter(d => d.sectorId === 'insurance' && within(d.sectorMetrics?.combinedRatio, 40, 110))
  .sort((a, b) => a.sectorMetrics.combinedRatio - b.sectorMetrics.combinedRatio)
  .slice(0, 5)
  .map(d => ({
    symbol: d.symbol,
    combined: d.sectorMetrics.combinedRatio?.toFixed(2),
    loss: d.sectorMetrics.lossRatio?.toFixed(2),
    floatYield: d.sectorMetrics.floatYield?.toFixed(2),
  }));
console.log('\nTop insurers by combined ratio:');
console.table(insurers);

// 3. REITs by payout ratio (sensible band 50–110%; lowest = most retained for growth)
const reits = data
  .filter(d => d.sectorId === 'reit'
    && d.sectorMetrics?.ffoPerShare != null
    && within(d.sectorMetrics?.payoutRatio, 50, 110))
  .sort((a, b) => a.sectorMetrics.payoutRatio - b.sectorMetrics.payoutRatio)
  .slice(0, 5)
  .map(d => ({
    symbol: d.symbol,
    ffoPerShare: d.sectorMetrics.ffoPerShare?.toFixed(2),
    payoutRatio: d.sectorMetrics.payoutRatio?.toFixed(1),
    debtToAssets: d.sectorMetrics.debtToAssets?.toFixed(1),
  }));
console.log('\nTop REITs by retained-FFO (lowest payout):');
console.table(reits);
The within(v, lo, hi) helper exists for one reason: real-world data has gaps and edge cases. A small subset of XBRL filings tag concepts in unusual ways, leading to nonsensical computed values for some companies. Filter for sensible bands as a hygiene step — it's good practice with any fundamentals API regardless of provider.
Step 3 — run it
node screen.mjsActual output from running the snippet against our production API (your numbers will reflect whichever fiscal years are most recent at the time you run):
Top banks by efficiency ratio
| Symbol | NIM % | Efficiency % | Loan / Deposit |
|---|---|---|---|
| JPM | 0.67 | 83.1 | 0.57 |
Top insurers by combined ratio
| Symbol | Combined % | Loss % | Float Yield % |
|---|---|---|---|
| PGR | 60.50 | 53.04 | 4.00 |
| ALL | 80.50 | 66.85 | 4.43 |
Top REITs by retained-FFO (lowest payout)
| Symbol | FFO / Share | Payout % | Debt / Assets % |
|---|---|---|---|
| EQIX | 34.61 | 54.6 | 47.5 |
| WELL | 4.37 | 61.6 | 28.8 |
| PLD | 6.41 | 63.2 | 36.0 |
| O | 3.84 | 81.5 | n/a |
| AMT | 8.00 | 85.3 | 53.5 |
Each table is ranked by the metric that actually matters for that business model. With a generic API you'd have to compute NIM, combined ratio, and FFO yourself from raw line items. Here it's three field reads. Note: not every company in the universe survives the sanity-band filter — that's the data quality reality of working with XBRL filings, and a key reason to apply hygiene filters before ranking.
industryId === 'semiconductor' and sort by industryMetrics.rdToRevenue. Want to rank pharma by cash runway? Filter industryId === 'pharma' and sort by industryMetrics.cashRunwayQuarters. The endpoint stays the same; only the field names change. The same business-model-aware philosophy drives the Revenue Segmentation API, which breaks each company's top line into the geography and product mix it actually disclosed.FAQ
Why do banks need different financial metrics than software companies?
Their business models are fundamentally different. A bank earns money from net interest margin (NIM) on a balance sheet of loans and deposits — gross profit and operating margin do not exist in the same way. Insurers underwrite policies and earn from a combined ratio (claims + expenses ÷ premiums), where below 100% means underwriting profit. REITs measure cash earnings via funds from operations (FFO) and adjusted FFO (AFFO), not net income. Applying one key-metrics shape across these business models silently produces meaningless ratios.
What metrics does StockFit return for banks?
Banking-specific metrics surface under sectorMetrics on /api/financials/key-metrics: net interest margin (NIM), efficiency ratio, return on assets (ROA), tangible book value per share, non-performing loans ratio, and tier 1 capital ratio. These come directly from XBRL facts in 10-K and 10-Q filings — no synthetic derivations. (The SEC Forms field guide walks through where these XBRL facts live in each filing.)
Does StockFit support REIT FFO and AFFO?
Yes. REIT-specific metrics include FFO (funds from operations), AFFO (adjusted FFO), FFO per share, AFFO per share, FFO payout ratio, and net asset value (NAV) where reported. They surface on /api/financials/key-metrics under the sectorMetrics block when the symbol is classified as a REIT.
How does StockFit classify a company's sector and industry?
Classification is sourced from the issuer's SIC code in their SEC filings, mapped onto a standardized sector and industry taxonomy. The mapping is exposed via /api/symbols/sectors, /api/symbols/industries, and /api/symbols/industry-groups for finer-grained cross-company comparison within specialized sectors.
Closing thought
Generic financial-data APIs solve the easy 70% of the universe (industrials, software, consumer) and silently fail on the other 30% (banks, insurers, REITs, specialty industries). StockFit's key-metrics endpoint returns three layered tiers so the right metric for the right business model is one field-read away — no per-issuer if-statements, no manual calculations from raw XBRL.
Run it yourself:
- Try the playground — no signup needed.
- Get a and run the screen above.
- For AI workflows, point your MCP-capable client at our MCP server — same key works.
More technical writing on the developer blog; live examples in Insights. Full API reference at api.stockfit.io/docs. Caught a fact wrong about FMP? info@stockfit.io and we'll update.
Ready to build?
Free API key, no credit card. Every endpoint mentioned in this post is available on the free tier.