How to Build a Stock Screener in Python
Build a stock screener in Python and pandas on a free API key: SEC financial statements, ROIC and debt to equity, and a 10-K link for every result.
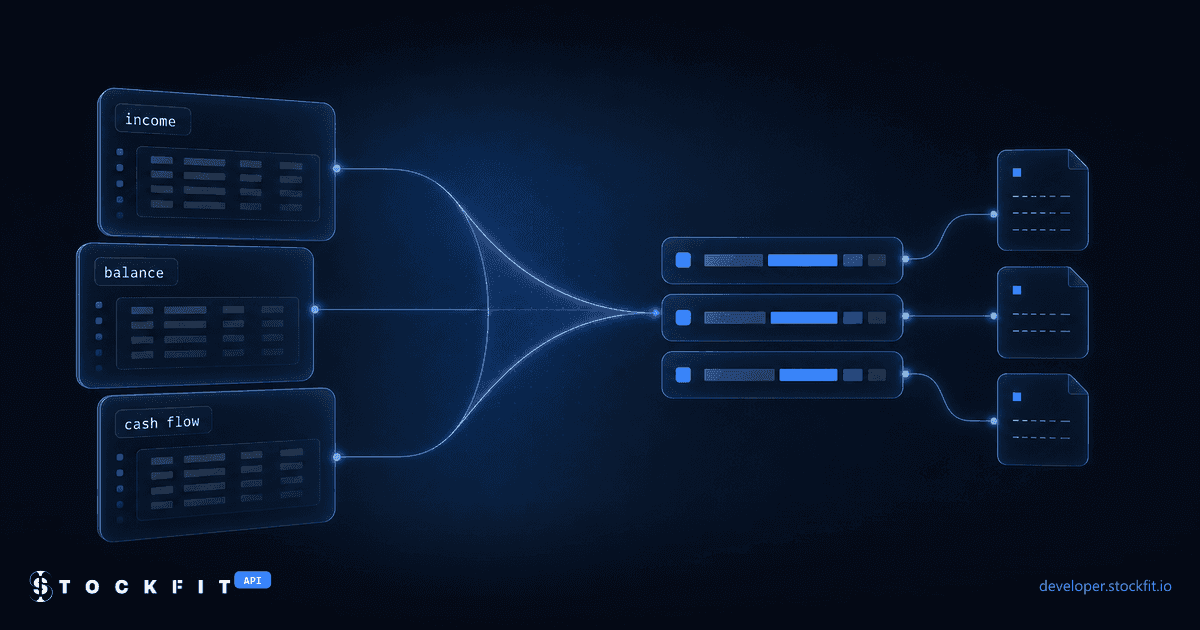
Most Python stock screener tutorials I found get their fundamentals from a scraped quote page or a vendor's screener endpoint, run a few filters and print a list. Getting a list is easy. I wanted to know if I can trust it. Which filing did that ROIC come from? Which debt was counted? And what happened to the companies where a value was missing?
So I built a fundamental screener in Python and pandas that answers those questions in its output. It runs on a free API key and pulls three financial statements per company. I wrote down how ROIC and debt to equity are calculated, missing values stay missing with a reason, and every stock that passes links to its 10-K. I ran it against production on 2026-11-18. Out of 33 stocks, 8 passed, 14 failed a rule and 11 dropped out because data was missing. The whole run took 100 requests.
What you need to get started
Python 3.9 or newer, pandas, requests and a StockFit API key. The income statement, balance sheet, cash flow statement and symbol lookup endpoints are all on the Free plan, so you can and run everything below. The Free plan allows 50 requests per minute and 300 per day. This screen needs 100, so you can run it a couple of times a day.
python -m venv .venv
source .venv/bin/activate          # Windows: .venv\Scripts\Activate.ps1
python -m pip install pandas requests
export STOCKFIT_API_KEY=your_api_key   # Windows: $env:STOCKFIT_API_KEY="your_api_key"
The screener is a single file, screener.py. I'll go through it in parts: the API client, fetching, the ratios, the screen itself, the links to the filings and main(). You can split it into modules if you prefer. First the client, which is the only part that makes HTTP calls:
# --- client.py ---
import hashlib
import json
import os
import time
from pathlib import Path

import requests

BASE_URL = "https://api.stockfit.io/v1"


class StockFitClient:
    def __init__(self, api_key, cache_dir=".cache", max_per_minute=45, cache_hours=24):
        if not api_key:
            raise ValueError("Set STOCKFIT_API_KEY")
        self.session = requests.Session()
        self.session.headers["Authorization"] = f"Bearer {api_key}"
        self.cache_dir = Path(cache_dir)
        self.cache_dir.mkdir(exist_ok=True)
        self.min_interval = 60 / max_per_minute
        self.cache_seconds = cache_hours * 3600
        self.last_call = 0.0

    def get(self, path, **params):
        key = hashlib.sha256(f"{path}?{sorted(params.items())}".encode()).hexdigest()
        cached = self.cache_dir / f"{key}.json"
        if cached.exists() and time.time() - cached.stat().st_mtime < self.cache_seconds:
            return json.loads(cached.read_text())
        body = self._fetch(path, params)
        cached.write_text(json.dumps(body))
        return body

    def _fetch(self, path, params, attempts=5):
        for attempt in range(attempts):
            wait = self.min_interval - (time.time() - self.last_call)
            if wait > 0:
                time.sleep(wait)
            self.last_call = time.time()
            try:
                r = self.session.get(BASE_URL + path, params=params, timeout=30)
            except (requests.Timeout, requests.ConnectionError):
                time.sleep(2 ** attempt)
                continue
            if r.status_code == 429 or r.status_code >= 500:
                time.sleep(float(r.headers.get("Retry-After", 2 ** attempt)))
                continue
            if r.status_code in (401, 403):
                raise PermissionError(f"{r.status_code} on {path}: {r.text}")
            r.raise_for_status()
            return r.json()
        raise RuntimeError(f"Gave up on {path} {params} after {attempts} attempts")
It sends the key as a Bearer token, keeps one requests.Session open, stays below 45 calls per minute and caches every response on disk for 24 hours. On a 429 or a 5xx it waits for Retry-After (or backs off) and tries again. Timeouts are retried too. A 401 or 403 stops the run, since a wrong key or a plan limit won't fix itself. After five failed attempts the client raises an error. I didn't want it to return an empty result, because then a company would just look like it has no data.
Three calls per company, and what comes back
For each company the screener calls /api/financials/income-statement, /api/financials/balance-sheet and /api/financials/cash-flow-statement with period=annual and limit=1, which gives the latest fiscal year. Here is Microsoft's FY2026 income statement, cut down to six line items. I added includeSourceDetails=true so you can see the XBRL concept behind each value:
{
  "period": "2026-06-30",
  "fiscalYear": 2026,
  "fiscalPeriod": "FY",
  "dateFiled": "2026-07-29",
  "facts": {
    "revenue": 331839000000,
    "operatingIncome": 155237000000,
    "incomeBeforeTax": 165934000000,
    "incomeTaxExpense": 32185000000,
    "netIncome": 133749000000,
    "ebitda": 207985000000
  },
  "sources": {
    "0001193125-26-323660": {
      "type": "10-K",
      "dateFiled": "2026-07-29",
      "amendment": false,
      "facts": {
        "revenue": {
          "concept": "us-gaap:RevenueFromContractWithCustomerExcludingAssessedTax",
          "unit": "USD"
        },
        "operatingIncome": {
          "concept": "us-gaap:OperatingIncomeLoss",
          "unit": "USD"
        },
        "incomeBeforeTax": {
          "concept": "us-gaap:IncomeLossFromContinuingOperationsBeforeIncomeTaxesExtraordinaryItemsNoncontrollingInterest",
          "unit": "USD"
        },
        "incomeTaxExpense": {
          "concept": "us-gaap:IncomeTaxExpenseBenefit",
          "unit": "USD"
        },
        "netIncome": {
          "concept": "us-gaap:NetIncomeLoss",
          "unit": "USD"
        }
      }
    }
  },
  "derived": [
    "sellingGeneralAndAdministrativeExpenses",
    "costAndExpenses",
    "depreciationAndAmortization",
    "ebit",
    "ebitda"
  ]
}
facts has the line items in US dollars. They are normalized, so operatingIncome is the same field for Microsoft and Walmart, even if the two companies tag it differently in XBRL. sources is keyed by accession number (the SEC's ID for a filing) and lists which facts came from that filing, plus the form type, filing date and whether it was an amendment. derived lists the values that were calculated instead of reported. EBITDA is one of them, since it isn't a GAAP line item. It's built from pretax income, interest expense, depreciation and amortization. The screener doesn't need the concept names, so it leaves includeSourceDetails off.
The fetch step puts the three statements into one dict per company. Where each fact came from goes into a separate list:
# --- fetch.py ---
STATEMENTS = {
    "income": "/api/financials/income-statement",
    "balance": "/api/financials/balance-sheet",
    "cashflow": "/api/financials/cash-flow-statement",
}
REPORTED_ONLY = {"operatingIncome"}


def load_company(client, symbol):
    row = {"symbol": symbol}
    audit = []
    for name, path in STATEMENTS.items():
        periods = client.get(path, symbol=symbol, period="annual", limit=1)
        if not periods:
            row[f"{name}_period"] = None
            continue
        latest = periods[0]
        row[f"{name}_period"] = latest["period"]
        derived = set(latest["derived"]) & REPORTED_ONLY
        row.update({k: v for k, v in latest["facts"].items() if k not in derived})
        for accession, source in latest["sources"].items():
            for field in source["facts"]:
                audit.append({"symbol": symbol, "field": field, "accession": accession,
                              "form": source["type"], "date_filed": source["dateFiled"]})
    return row, audit
I added REPORTED_ONLY after my first run. It means operating income only counts if the company reported it. Chevron and Johnson & Johnson don't have an operating income line in their income statements, and in my first run Chevron passed the screen with a number you won't find in its 10-K. I didn't want to rank companies on numbers they never published. You'll see the effect in the results further down.
Loading it into a pandas DataFrame
pd.DataFrame(rows).set_index("symbol") gives one row per company and one column per line item, about 180 columns across the three statements. No reshaping needed. If you build a pandas stock screener on the SEC's raw companyfacts files instead, you get a long table of XBRL concepts. The same value shows up once for every filing that repeats it, amendments and restatements need to be deduplicated, and pivot_table averages duplicates without telling you. The normalized statements already take care of that.
The list of sources becomes a second DataFrame called audit, with one row per fact: symbol, field, accession number, form and filing date. I keep it separate so that no merge or filter later can lose it. The inputs of one ratio can also come from different filings, so each fact keeps its own.
Before calculating anything I check two things. The three statements need to cover the same fiscal year, so the screen compares the three *_period columns and flags a mismatch. Otherwise you could end up dividing this year's operating income by last year's capital. And the units need to match. Dollar amounts are in US dollars, and the ratios come out as decimals, so 0.15 means 15%. Some data sources return debt to equity as a percentage (150 for 1.5x). Run a < 0.5 filter on that and almost every company with any debt fails.
Calculating ROIC and debt to equity in pandas
There is more than one way to define both ratios, so I put my definitions in the code. This is what the screener uses:
- ROIC = NOPAT / invested capital. NOPAT is operating income x (1 minus the tax rate). Invested capital is borrowings plus stockholders' equity minus cash, at year end.
- Debt to equity = borrowings / stockholders' equity. Borrowings are
totalBorrowings: long-term debt, the current part of it and short-term borrowings. Leases are not included.
# --- metrics.py ---
import numpy as np
import pandas as pd

STATUTORY_TAX_RATE = 0.21


def add_ratios(df):
    pretax = df["incomeBeforeTax"]
    effective = (df["incomeTaxExpense"] / pretax).where(pretax > 0)
    usable = effective.between(0, 0.5)
    df["tax_rate"] = effective.where(usable, STATUTORY_TAX_RATE)
    df["nopat"] = df["operatingIncome"] * (1 - df["tax_rate"])

    equity = df["stockholdersEquity"].where(df["stockholdersEquity"] > 0)
    leases = df[["operatingLeaseLiability", "financeLeaseLiability"]].sum(axis=1, min_count=1)
    df["invested_capital"] = df["totalBorrowings"] + equity - df["cash"]
    df["roic"] = (df["nopat"] / df["invested_capital"]).where(df["invested_capital"] > 0)
    df["debt_to_equity"] = df["totalBorrowings"] / equity
    df["debt_to_equity_leases"] = (df["totalBorrowings"] + leases) / equity
    return df
All columns are vectorized, so this works the same for 33 companies or 3,000. totalBorrowings is a derived field, but it's a simple sum you can check. For Walmart it's $34,624 million of long-term debt, $6,596 million of short-term borrowings and $3,542 million of current long-term debt. That adds up to $44,762 million, and all three numbers are in the 10-K.
How a tax benefit turned Qualcomm into a 30% ROIC company
The usual tax rate is income tax expense divided by pretax income. Qualcomm's fiscal 2026 10-K shows $9,414 million of pretax income and an income tax line of $-4,214 million. That's a tax benefit, and it gives an effective tax rate of -44.8%. With that rate, NOPAT ends up larger than operating income, and Qualcomm's ROIC comes out at 30.7%. That's what my first version showed.
A one-time tax benefit says nothing about how well the business runs. So add_ratios only uses the effective rate if it's between 0% and 50% and pretax income is positive. Otherwise it uses the 21% US statutory rate. With that rule Qualcomm's ROIC is 16.7%. It still passes the 15% minimum, but it's no longer near the top. The rule also covers losses: Intel had positive pretax income but an operating loss, so its ROIC is negative.
I also guard the divisions. Negative stockholders' equity happens after large buybacks, and it makes debt to equity negative, which would pass a < 0.5 cap. So equity at or below zero becomes NaN before anything is divided by it. Invested capital at or below zero becomes NaN for ROIC the same way.
Why some companies drop out of the screen
If a value is missing, the screen should keep it missing and tell you. pandas makes this easy to get wrong. Every comparison with NaN returns False, which is fine until you negate a mask or fill the gaps:
import numpy as np
import pandas as pd

de = pd.Series({"MSFT": 0.09, "JPM": 1.20, "XYZ": np.nan})

de < 0.5        # MSFT True, JPM False, XYZ False: NaN fails every comparison
~(de < 0.5)     # MSFT False, JPM True, XYZ True: negate it and NaN "fails the cap"
de.fillna(0) < 0.5   # XYZ True: a missing balance sheet now looks debt-free
In the first line XYZ disappears and you don't know why. The second line is the typical "which companies failed" mask, and it counts XYZ as failed. In the third line XYZ passes. That's why screen() checks notna() before applying any rule and has three outcomes: passed, failed a rule, or missing data, with the missing fields listed. In my Node.js stock screener I ran into the JavaScript version of this, where null <= 1 is true.
Here are six rows from the exclusion log of my run:
symbol status        missing                       failed
AAPL  failed        -                             debt_to_equity
INTC  failed        -                             roic,free_cash_flow
JPM   missing_data  operatingIncome,freeCashFlow  debt_to_equity
CVX   missing_data  operatingIncome               -
PLD   missing_data  freeCashFlow                  roic,debt_to_equity
ORCL missing_data incomeBeforeTax roic,debt_to_equity,free_cash_flow- JPMorgan has no operating income and no free cash flow. Banks don't report either. For a bank, the interest it pays on deposits and borrowings is part of running the business, and its cash flow statement has no capex line like an industrial company. ROIC doesn't say much about a bank anyway.
- Chevron has no operating income line in its income statement. The API response has a value for it under
derived, calculated from other line items, andREPORTED_ONLYremoves it. An oil company's costs (purchased crude oil and products, operating costs, exploration, depreciation and depletion) don't fit neatly into cost of revenue and operating expenses. I'd rather leave Chevron out than rank it on a number it never reported. - Prologis has no free cash flow. As a REIT it spends money on developing and buying properties, and that isn't reported as regular capex.
- Oracle reports its pretax income under its own extension concept,
orcl:IncomeLossFromContinuingOperations...BeforeIncomeTaxes..., with $19,554 million for fiscal 2026. The normalized field stays empty instead of guessing. /api/financials/as-reported returns every concept a company filed, including extensions, if you want to map it yourself.
With fillna(0) all four would have a zero in the data, and you couldn't tell any of these reasons apart anymore.
From 33 stocks to 8
The screen has four rules: ROIC above 15%, debt to equity below 0.5, revenue above $1 billion and positive free cash flow. These thresholds are just examples to show how it works. They are not investment advice.
# --- screen.py ---
RULES = {
    "roic": ("roic", lambda s: s > 0.15),
    "debt_to_equity": ("debt_to_equity", lambda s: s < 0.5),
    "revenue": ("revenue", lambda s: s > 1e9),
    "free_cash_flow": ("freeCashFlow", lambda s: s > 0),
}
INPUTS = ["operatingIncome", "incomeBeforeTax", "totalBorrowings", "stockholdersEquity", "cash", "revenue", "freeCashFlow"]


def screen(df):
    periods = df[["income_period", "balance_period", "cashflow_period"]]
    mismatch = periods.nunique(axis=1, dropna=False) > 1
    missing = df[INPUTS].isna()
    df["missing"] = missing.apply(lambda r: ",".join(r.index[r]), axis=1)
    df.loc[mismatch, "missing"] = "period_mismatch"

    failed = pd.Series("", index=df.index)
    for name, (column, test) in RULES.items():
        fails = df[column].notna() & ~test(df[column])
        failed = failed.where(~fails, failed + name + ",")
    df["failed"] = failed.str.rstrip(",")

    passed = (df["missing"] == "") & (df["failed"] == "")
    df["status"] = np.select([df["missing"] != "", df["failed"] != ""], ["missing_data", "failed"], "passed")
    return df[passed].sort_values("roic", ascending=False)
missing lists every input that's missing, failed lists every rule a company broke with the data it has, and status is one of the three outcomes. A company can show up in both columns. JPMorgan above fails the debt to equity rule and is also missing operating income. Companies that pass are sorted by ROIC. Here is the beginning of the output:
status
failed          14
missing_data    11
passed           8
         roic  debt_to_equity       revenue  freeCashFlow  form             accession
symbol
NVDA    0.713           0.054  215938000000  9.667600e+10  10-K  0001045810-26-000021
COST    0.404           0.172  303154000000  9.382000e+09  10-K  0000909832-26-000093
MSFT    0.271           0.091  331839000000  6.698700e+10  10-K  0001193125-26-323660
GOOGL   0.248           0.117  402836000000  7.326600e+10  10-K  0001652044-26-000018
META    0.244           0.270  200966000000  4.610900e+10  10-K  0001628280-26-003942
WMT     0.169           0.449  713163000000  1.492300e+10  10-K  0000104169-26-000055
QCOM    0.167           0.497   43120000000  8.651000e+09  10-K  0000804328-26-000128
AMZN    0.164           0.167  716924000000  7.695000e+09  10-K  0001018724-26-000004
The three counts add up to 33, so no company got lost along the way. The ones that passed are NVDA, COST, MSFT, GOOGL, META, WMT, QCOM, AMZN. Apple only fails on debt, with debt to equity of 0.71, and so do Coca-Cola, PepsiCo and Procter & Gamble. For me a list like this is where I start reading filings. If you want to dig into one of these companies, my DCF model in Python uses the same three statements.
Count the leases and Walmart fails
Without leases, Walmart's debt to equity is 0.45 and it passes. Walmart also has $15,572 million of operating lease liabilities and $6,761 million of finance lease liabilities. Many credit analysts count those as debt for a retailer that leases its stores. Add them and Walmart is at 0.67, which fails the cap. Qualcomm goes from 0.497 to 0.526 and fails as well.
Both versions come from the same add_ratios call. The lease sum uses min_count=1, so a company that reports no lease numbers gets NaN and not zero. Both definitions are fine. Pick the one that fits what you screen for, and look closer at the companies that land near the cap.
Linking every result to its 10-K
For every stock that passes, I want to be able to open the filing the numbers came from. The audit table has the accession number of every input, and one call to /api/lookup/batch returns the CIK for up to 50 tickers. With those two you can build the EDGAR link. It uses the CIK without leading zeros and the accession number without dashes, as described in the SEC's guide to accessing EDGAR data.
# --- audit.py ---
def edgar_url(cik, accession):
    folder = accession.replace("-", "")
    return f"https://www.sec.gov/Archives/edgar/data/{int(cik)}/{folder}/{accession}-index.htm"


def attach_sources(shortlist, audit, ciks, field="operatingIncome"):
    src = audit[audit["field"] == field].set_index("symbol")[["accession", "form", "date_filed"]]
    out = shortlist.join(src)
    out["cik"] = out.index.map(ciks)
    out["source_url"] = [edgar_url(c, a) for c, a in zip(out["cik"], out["accession"])]
    return out
attach_sources adds the source of one input, operating income, to every company that passed. For Qualcomm that's 10-K 0000804328-26-000128, filed on 2026-11-04. On its EDGAR index page you can find the tax benefit from above. If you want a link for every input, call it once per field (debt, equity, cash). Most of the time they all come from the same 10-K, but after an amendment or a restatement they can differ.
The link tells you where a number comes from. Whether the definition fits your strategy is still up to you. If a result looks too good, open the filing, find the line items behind the ratio and check the concept, period and unit. Debt filed under an unusual concept, or cash held as short-term investments, can change a ratio even when the data itself is correct.
Last, main() puts it all together. It looks up the CIKs, loads every company, calculates, screens and writes two CSV files with the date in the name: the companies that passed with their source links, and the full list with status, missing and failed columns.
# --- main.py ---
WATCHLIST = [
    "AAPL", "MSFT", "NVDA", "GOOGL", "META", "AMZN", "AVGO", "ADBE", "CRM", "ORCL", "CSCO", "INTC", "AMD", "QCOM", "TXN",
    "COST", "WMT", "KO", "PEP", "PG", "JNJ", "UNH", "CAT", "DE", "HON", "SLB", "CVX",
    "JPM", "BAC", "GS", "PGR", "O", "PLD",
]


def main():
    client = StockFitClient(os.environ.get("STOCKFIT_API_KEY"))
    profiles = client.get("/api/lookup/batch", symbols=",".join(WATCHLIST))
    ciks = {symbol: p["cik"] for symbol, p in profiles.items()}

    rows, audit = [], []
    for symbol in WATCHLIST:
        row, facts = load_company(client, symbol)
        rows.append(row)
        audit.extend(facts)

    df = add_ratios(pd.DataFrame(rows).set_index("symbol"))
    audit = pd.DataFrame(audit)
    shortlist = attach_sources(screen(df), audit, ciks)

    print(df["status"].value_counts().to_string())
    print(shortlist[["roic", "debt_to_equity", "revenue", "freeCashFlow", "form", "accession"]].round(3).to_string())
    print(df.loc[df["status"] != "passed", ["status", "missing", "failed"]].to_string())

    stamp = time.strftime("%Y-%m-%d")
    shortlist.to_csv(f"screen-{stamp}.csv")
    df.to_csv(f"universe-{stamp}.csv")


if __name__ == "__main__":
    main()
Rate limits, caching and running it daily
33 stocks take 100 requests: three statements per company plus one batch lookup. At 45 per minute the first run takes a little over two minutes. A second run on the same day makes no requests at all, because everything comes from the disk cache. Annual statements only change once a year per company, so you can keep the cache a lot longer. Use the fiscal period in the response as the key and refresh a company when it files a new 10-K.
- More stocks. /api/symbols lists every supported stock and can filter by exchange and sector. A few hundred companies at three calls each is more than the Free plan's 300 requests per day. For a whole sector you need a paid plan, or you spread the first run over a few days and let the cache keep what you already have. If you want to build this into a product, the stock screener API page has the details.
- Scheduling. A cron line like
0 7 * * 1-5 /path/to/.venv/bin/python /path/to/screener.pyruns it every weekday morning. In GitHub Actions you can use ascheduletrigger and store the key as a repository secret. - Comparing runs. The CSV files have the date in their name. Compare today's list with last week's to see which companies are new and which dropped out. The full list also shows whether a company dropped out because of a rule or because data was missing.
- Quarterly updates.
period=ttmadds up the last four quarters for the income and cash flow statements and uses the latest quarterly balance sheet. The screen then changes every quarter instead of once a year.
FAQ
Q.How do you build a stock screener in Python?
Q.Can you build a stock screener in Python for free?
Q.What is the best data source for a Python stock screener?
Q.How do you calculate ROIC in pandas?
Q.Should missing values be filled with zero in a stock screener?
Q.Why does my pandas filter drop rows with NaN?
df["roic"] > 0.15 leaves those rows out without telling you. It also works the other way: ~(df["roic"] > 0.15) is True for NaN rows, so a "failed" mask counts missing data as failed. Check notna() first and keep missing data as its own outcome.Q.Can you backtest this stock screener?
before when a later filing changes them) and a universe that includes delisted companies. The guide to point-in-time data for backtesting shows how.Ready to build?
Free API key, no credit card.