ETF Expense Ratio and Fee API
Compare ETF expense ratios and fees via API: management fee, disclosed waivers, and acquired-fund costs the headline number hides.
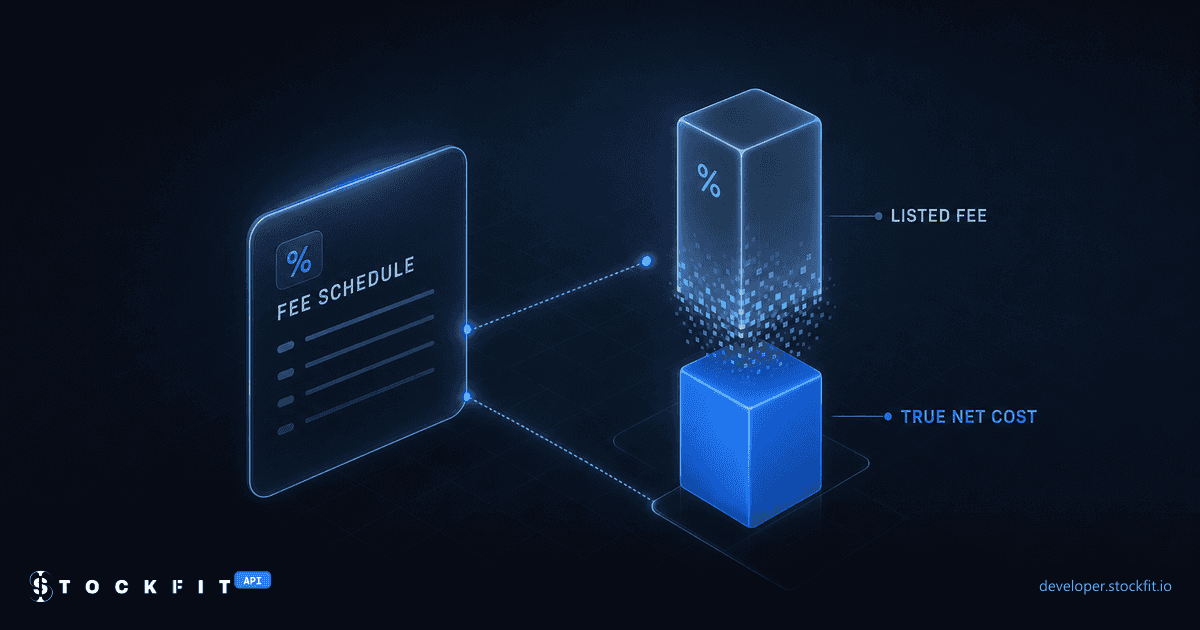
Every ETF comparison site shows you the same single number: the expense ratio. It is a real figure and it matters, but it is also the only line most comparison tools bother to surface, and for a growing share of funds it is not even the number an investor actually pays. Underneath that one headline percentage sits a fee table with a management fee, sometimes a distribution fee, sometimes a pass-through cost from an underlying fund, and occasionally a contractual waiver that brings the number down. None of that is hidden exactly, it is disclosed every year in the fund's own SEC filings, but no consumer tool queries it, and until now there was no API that did either.
Every figure in this post is pulled from the live StockFit production API as of 2026-08-15, straight from each fund's most recently filed fee table, with the SEC accession number attached. Nothing here is estimated.
What the headline expense ratio hides
"Expense ratio" is shorthand for several distinct line items that a fund's prospectus reports separately: a management fee paid to the adviser, sometimes a 12b-1 distribution fee, other operating expenses, and for funds that invest partly through another registered fund, acquired fund fees and expenses (AFFE), the pass-through cost of that underlying vehicle. Add those up and you get the totalExpenseRatio. If the adviser has agreed to waive or reimburse part of that total, contractually or voluntarily, the fund also discloses a netExpenseRatio, the number that is actually deducted from your return. A consumer site that shows one percentage is showing you one of those, usually the net figure, with no way to see whether a waiver is doing the work or how long it is contracted to last.
PDBC, Invesco's diversified commodity strategy ETF, is the clearest case in this sample. Its most recent fee table (filed 2026-02-26, accession 0001104659-26-020374) discloses a 0.59% management fee plus 0.15% in acquired fund fees from the subsidiary it uses for commodity exposure, for a 0.74% total. A 0.15% waiver brings the net expense ratio an investor actually pays down to 0.59%. A screener that only shows "0.59%" is not wrong, but it is showing you the output of a waiver arrangement without telling you one exists.
Not every fund has a waiver to disclose, and that is informative too. SCHD and ARKK both report management fee, total, and net expense ratio as the identical flat number, 0.06% and 0.75% respectively, with no waiver line at all: what you see is what you pay, no cap agreement in force. MOAT reports the same shape but with a fee-waiver field that is explicitly zero rather than blank, a small distinction, disclosed-and-inactive versus never-applicable, that only shows up if you read the actual filing field rather than a single rendered percentage.
Where ETF fee data actually lives in SEC filings
The fee table itself comes from Form N-1A, the registration statement open-end management investment companies file with the SEC, specifically the Item 3 Risk/Return Summary fee table every share class discloses in its prospectus. That is the management fee, 12b-1 fee, other expenses, AFFE, total, waiver, and net expense ratio, all in one structured table, refiled at least annually. Separately, Form N-CEN, the fund's annual operational census, carries a set of yes/no flags, including whether an expense limitation agreement is in force and whether fees were reduced or waived during the period, alongside brokerage commission and creation-unit detail the prospectus does not cover.
N-CEN also discloses the fund's full operational service-provider roster, custodian, transfer agent, securities-lending agent, and more, a separate layer from fees covered in our ETF custodian and service provider API post. JEPI shows why both filings matter and neither is the full picture alone. Its N-CEN flags isExpenseLimitation and isExpenseReducedOrWaived as true in every reported period back to 2020, evidence of a standing contractual expense cap. But its N-1A fee table has shown a flat 0.35% total expense ratio with no populated waiver figure since 2022, because the fund's actual expenses have stayed at or under the cap every period, so there is nothing to waive back. A cap that exists but has never bound is a materially different thing from no cap at all, and only cross-referencing both filings tells you which one you are looking at.
There is a structural trap on top of that: not every ETF is a Form N-1A open-end fund at all. SPY and QQQ, two of the largest ETFs that exist, are organized as unit investment trusts, a different legal structure that does not register on Form N-1A the way JEPI, SCHD, or PDBC do. Query the N-1A-sourced fee-schedule endpoint for a UIT and you get an empty result, not because the fund hides its costs, but because its expense disclosure lives in a different filing shape entirely. A fee API that silently returns nothing for a UIT and a populated row for an open-end fund is telling you something real about fund structure, not failing, and it is a distinction the underlying N-1A registration rule itself draws, and one worth knowing before you build a screener that assumes every ETF answers the same query the same way. For the fund census filing behind the waiver flags, the SEC publishes the Form N-CEN instructions directly. For the trust-versus-series distinction that also trips up fund identifiers more broadly, see our guide to mapping a fund's CIK to its ticker, and for where N-1A and N-CEN sit among the rest of the SEC's filing taxonomy, see our field guide to SEC forms.
Consumer comparison tools vs a queryable fee API
Search for a way to compare ETF expense ratios and you land on a comparison widget: ETF Database, Schwab, ETFSift, ETF BFF, all built for a person clicking through two tickers at a time on a web page. They are good at that job. None of them expose an API, so none of them can feed a screener, a portfolio-monitoring script, or an AI agent that needs to check a fund's cost structure programmatically as one step in a larger workflow. That gap is not a coverage problem, the underlying data is public and these sites parse it correctly, it is a delivery-format problem: the data stops at a rendered table.
The StockFit ETF data API closes that gap for fees specifically. /api/fund/fees returns the N-1A fee table as structured JSON, one call per ticker, paginated across every filed version so you can see how a fee changed over time, not just the current snapshot. /api/fund/fee-analysis layers in the N-CEN operational flags and, where disclosed, the fund's aggregate brokerage commissions by broker, the in-kind creation and redemption efficiency, and whether the fund carries a line of credit. Together they answer "what does this fund actually cost" as a query instead of a lookup.
Fee analysis API walkthrough: live JSON
Start with the fee schedule. Here is the top of PDBC's most recent filing, the disclosed waiver and all, from /api/fund/fees:
curl -H "Authorization: Bearer $TOKEN" \
"https://api.stockfit.io/v1/api/fund/fees?symbol=PDBC&pageSize=1"{
"page": 1, "pageSize": 1, "totalPages": 8, "totalResults": 23,
"data": [
{
"filedDate": "2026-02-26",
"accessionNumber": "0001104659-26-020374",
"managementFee": 0.0059,
"acquiredFundFees": 0.0015,
"totalExpenseRatio": 0.0074,
"feeWaiver": -0.0015,
"netExpenseRatio": 0.0059
}
]
}Every value is a decimal fraction (0.0059 is 0.59%), and every row carries its own filedDate and accessionNumber, so a change in fee, or a waiver expiring, is traceable to the exact filing that changed it rather than a silently updated number. Requesting the endpoint without a page limit returns the full filing history for the ticker, which is what powers the "did this fund's fee change" question a point-in-time scrape cannot answer.
Now the operational layer, from /api/fund/fee-analysis for JEPI, the fund with the standing-but-unbound expense cap:
curl -H "Authorization: Bearer $TOKEN" \
"https://api.stockfit.io/v1/api/fund/fee-analysis?symbol=JEPI"{
"feeRecords": [
{
"reportDate": "2025-06-30",
"isExpenseLimitation": true,
"isExpenseReducedOrWaived": true,
"isFeesWaivedRecoupable": false,
"monthlyAvgNetAssets": 37571049837.85,
"aggregateCommission": 2936629.50,
"hasLineOfCredit": true,
"lineOfCreditSize": 100000000
}
],
"brokerCommissions": [
{ "providerName": "BofA Securities, Inc.", "commission": 328779.65 },
{ "providerName": "Barclays Capital, Inc.", "commission": 321961.83 },
{ "providerName": "UBS Securities LLC", "commission": 261478.01 }
]
}The expense-limitation flags confirm the cap exists; the fee-table endpoint above confirms it currently costs nothing extra. brokerCommissions is a cost most fee comparisons never touch at all, the trading cost the fund itself pays to execute its portfolio, disclosed once a year and broken out by counterparty. It is not part of the expense ratio, but it is a real cost the fund bears, and it is only visible in the N-CEN operational filing, which is why /api/fund/fund-health pairs with fee analysis as the natural next call: cost and operational soundness, from the same annual census.
The on-ramp for either endpoint is /api/fund/profile, free-tier and Starter-accessible, which resolves a ticker to its fund series and returns the quarterly net assets, sales, and redemptions the fee context below draws on.
Screening by true cost, not the sticker ratio
An expense ratio only becomes a real dollar figure once you multiply it by assets, and assets move independently of the fee. JEPI and ARKK make the point cleanly: both are actively managed, both charge a flat fee with no waiver in JEPI's current fee table, and both are large, well-known funds. But their asset trajectories since 2020 have gone in opposite directions.
JEPI grew from under $200 million to nearly $44 billion in five years. ARKK peaked above $21 billion in 2021, fell to roughly $5.4 billion by 2024, and sat at about $6.5 billion as of its most recent N-PORT report. Napkin math, not either fund's actual disclosed revenue (which accrues on daily average net assets across the year, not one quarter-end snapshot): 0.35% of $43.96B is roughly $153.9M a year, versus 0.75% of $6.48B at roughly $48.6M. A lower headline percentage on a fast-growing fund can be worth far more in real terms than a higher one on a shrinking fund, which is exactly the kind of comparison a static expense-ratio table cannot make and a queryable API, joining fee data to N-PORT asset history, can.
Screening a watchlist for true cost means pulling three things per ticker: the net expense ratio and whether a waiver is propping it up from /api/fund/fees, the operational flags and brokerage cost from /api/fund/fee-analysis, and current assets from /api/fund/profile. Joined on ticker, that is a cost profile a comparison widget cannot produce: which funds have an active waiver expiring, which funds pay disproportionate trading costs relative to size, and which fund's low sticker price is backed by a growing or a shrinking asset base. For the rest of what N-CEN discloses about a fund's operational layer beyond fees, our ETF deep-lens tour covers the full picture, and for the daily portfolio data that pairs with cost analysis, see our daily ETF holdings API post.
FAQ
Q.How do I compare ETF expense ratios and fees via API?
/api/fund/fees with a ticker to get the fund's most recent SEC Form N-1A fee table (management fee, total expense ratio, waiver, and net expense ratio) as JSON, paginated across every filed version. Pair it with /api/fund/fee-analysis for the N-CEN operational flags (expense limitation, waiver status, brokerage commissions) that the fee table alone does not disclose. Both require the ETF or Professional plan; /api/fund/profile for the surrounding fund identity is on the free tier.Q.What is the difference between an ETF's gross and net expense ratio?
Q.Why does an ETF fee API return no results for SPY or QQQ?
Q.What does it mean when an ETF has an expense limitation agreement?
isExpenseLimitation) and whether fees were actually reduced or waived in the period (isExpenseReducedOrWaived). A fund can have an active agreement in force every period, as JEPI does, without ever needing to use it, if its actual costs stay under the cap.Q.What are acquired fund fees and expenses (AFFE) on an ETF?
Q.How current is StockFit's ETF fee data?
filedDate on every row tells you exactly how fresh that fund's fee data is, rather than a single "last updated" timestamp for the whole dataset.Q.Which subscription tiers include the ETF fee analysis API?
/api/fund/fees and /api/fund/fee-analysis are on the ETF plan ($59/mo, $39/mo billed annually) and the Professional plan ($99/mo, $69/mo billed annually). /api/fund/profile, the fund-identity on-ramp, is included on the free tier. You can get a token from the StockFit dashboard and call it immediately, no credit card required to sign up.Ready to build?
Free API key, no credit card.