Best Semiconductor ETFs 2026: What Each One Holds
Best semiconductor ETFs for 2026 compared by SEC N-PORT holdings: SMH vs SOXX overlap, the DRAM memory ETF, chip equipment exposure, fees, and returns.
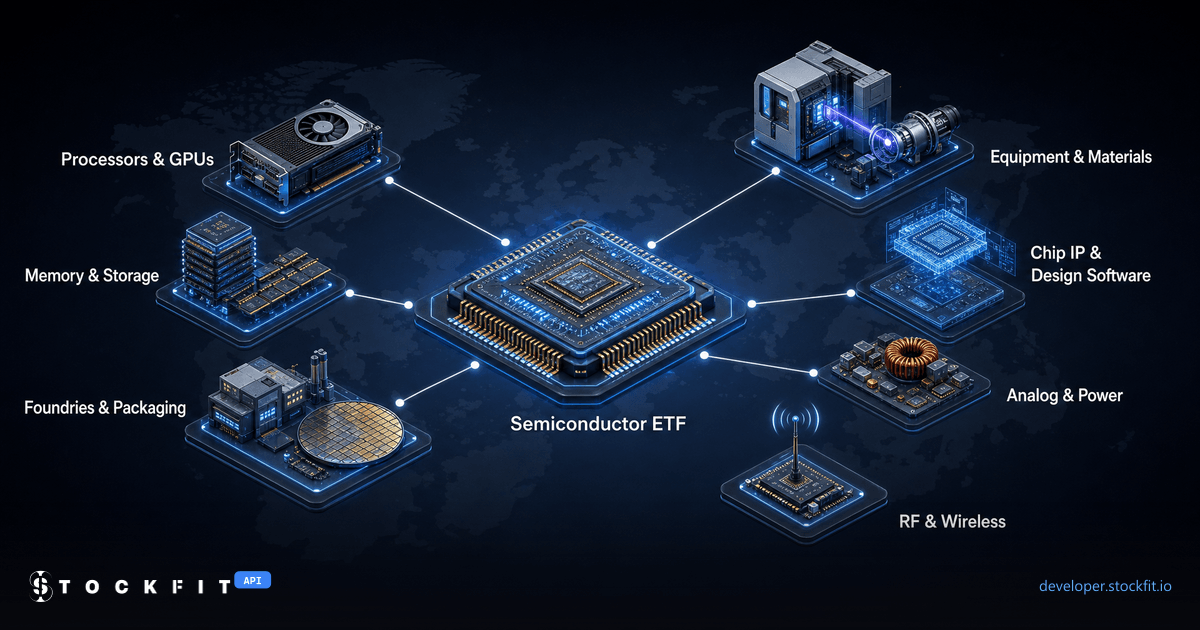
Every AI model runs on chips, and in 2026 the chip trade stopped being one trade. Nvidia, the name most people think of first for AI chips, is up 19.3% this year through October 21, 2026. Micron is up 220.4%, SanDisk 480.6%, and Intel 151.9%. So when I went looking for the best semiconductor ETFs of 2026, the first question was not which fund ranks highest. It was which part of the chip supply chain each fund actually owns.
The roundups that rank for this search list an expense ratio, assets under management, a recent return, and the top holdings. None that we found splits these funds into chip designers, memory makers, foundries, and equipment makers with an as-of date, or opens the filing behind DRAM, the memory ETF that launched in April and holds much of its exposure through swaps.
So we built it from SEC filings with the StockFit API. /api/fund/holdings returned every position in each fund's latest N-PORT report, /api/company/details tagged each company with its industry, and fee tables, fund flows, and prices came from three more endpoints. Every fund figure below is a field from those responses or from the SEC filing named next to it, captured on October 22, 2026. It is data, not investment advice.
The semiconductor supply chain: who makes an AI chip
An AI accelerator passes through several companies before it reaches a data center. One company designs it, using design software and often licensed chip IP from others. A foundry manufactures it on machines built by equipment makers, and memory makers supply the high-bandwidth memory packaged next to it. The public companies behind those steps fall into seven layers, and we used these layers to classify every holding before looking at how any fund markets itself:
Design the chips that compute: GPUs and AI accelerators, CPUs, custom chips for cloud companies, and the networking chips that connect them. Examples held by these funds: Nvidia, AMD, Broadcom, Intel, Marvell, Astera Labs.
Make the memory every processor needs, including the high-bandwidth memory (HBM) packaged next to AI accelerators, plus flash and disk storage. Examples held by these funds: Micron, SK hynix, Samsung Electronics, SanDisk, Kioxia, Seagate.
Convert, regulate, and sense: power management chips, microcontrollers, and analog chips in cars, factories, and servers. Examples held by these funds: Texas Instruments, Analog Devices, NXP, Microchip, ON Semiconductor, Monolithic Power.
The radio side of phones and wireless devices: modems, RF front ends, and connectivity chips. Examples held by these funds: Qualcomm, Skyworks, Qorvo, MACOM.
License chip architectures and sell the software engineers use to design chips. Examples held by these funds: Arm, Synopsys, Cadence, Rambus.
Manufacture chips that other companies design, then package and test them. Examples held by these funds: TSMC, GlobalFoundries, United Microelectronics, Tower Semiconductor, ASE, Amkor.
Build the machines and supply the materials chip factories run on: lithography, deposition, etch, inspection, and test. Examples held by these funds: ASML, Applied Materials, Lam Research, KLA, Tokyo Electron, Teradyne.
The layer mattered more than the label this year. Here is how a dozen of the companies these funds hold most did in 2026 through October 21, 2026:
| Company | Layer | 2026 to Oct 21 |
|---|---|---|
| Nvidia NVDA | Processors, GPUs, and logic | +19.3% |
| AMD AMD | Processors, GPUs, and logic | +158.6% |
| Broadcom AVGO | Processors, GPUs, and logic | -1.6% |
| Intel INTC | Processors, GPUs, and logic | +151.9% |
| Micron MU | Memory and storage | +220.4% |
| SanDisk SNDK | Memory and storage | +480.6% |
| Texas Instruments TXN | Analog and power | +66.8% |
| Qualcomm QCOM | RF and wireless | +5.4% |
| Arm ARM | Chip IP and design software | +106.5% |
| TSMC TSM | Foundries and packaging | +43.2% |
| ASML ASML | Equipment and materials | +57.5% |
| Applied Materials AMAT | Equipment and materials | +59.9% |
Total return from adjusted closes, December 31, 2025 to October 21, 2026, from /api/price/history. Past performance, not a forecast.
Memory led by a wide margin: SanDisk +480.6% and Micron +220.4%, against +19.3% for Nvidia and -1.6% for Broadcom. With gaps that wide, a fund's mix of layers went a long way toward deciding its year. The same holdings-first approach graded the best AI ETFs of 2026 and the best data center ETFs, and the lesson carries over: the fund name tells you little until you read the portfolio.
How we compared ten semiconductor ETFs
We took the two giants, SMH and SOXX, the four other index funds above $2 billion we found (XSD, FTXL, SOXQ, PSI), three newer funds built around one theme (DRAM for memory, SMHX for fabless chip designers, CHPX for AI chips and quantum computing), and CHPS, the lowest expense ratio of the ten. Leveraged funds such as SOXL are a different product and are left out. All ten file N-PORT reports with the SEC, which is where every weight below comes from.
Step 1: every holding, from the N-PORT report
/api/fund/holdings returns one row per position from a fund's latest N-PORT report, sorted by weight, with the CUSIP and ISIN, the value, the percent of net assets, the issuer's country, and the issuer's CIK and ticker where one exists. The first two of SMH's 26 rows:
curl "https://api.stockfit.io/v1/api/fund/holdings?symbol=SMH&pageSize=1000" \
-H "Authorization: Bearer $STOCKFIT_API_KEY"{
"reportDate": "2026-06-30",
"totalResults": 26,
"data": [
{
"name": "NVIDIA Corp",
"cusip": "67066G104",
"isin": "US67066G1040",
"ticker": "NVDA",
"valueUsd": 13547213303.91,
"pctVal": 17.54859673435,
"assetCat": "EC",
"country": "US",
"mappedCik": 1045810,
"mappedSymbol": "NVDA"
},
{
"name": "Taiwan Semiconductor Manufacturing Co Ltd",
"cusip": "874039100",
"isin": "US8740391003",
"ticker": "TSM",
"valueUsd": 7170996749.01,
"pctVal": 9.28906390626,
"assetCat": "EC",
"country": "TW",
"mappedCik": 1046179,
"mappedSymbol": "TSM"
}
]
}TSMC is a Taiwanese company, but it files annual reports with the SEC and its depositary receipts trade in New York, so the row carries a CIK. That CIK is the key to everything that follows.
Step 2: an industry for every company
For each mapped CIK, /api/company/details returns StockFit's SFIC industry, which is finer than the SIC code next to it. Trimmed to the classification fields:
curl "https://api.stockfit.io/v1/api/company/details?cik=1046179" \
-H "Authorization: Bearer $STOCKFIT_API_KEY"{
"name": "TAIWAN SEMICONDUCTOR MANUFACTURING CO LTD",
"cik": 1046179,
"sic": "3674",
"sector": "Information Technology",
"industry": "Semiconductors",
"industryGroup": "Semiconductors",
"symbols": [
"TSM",
"TSMWF"
],
"country": "Taiwan"
}SFIC splits the chip industry into processors, memory, analog, power, RF, chip IP, and equipment, and leaves the foundries in the broad Semiconductors bucket, which is where TSMC sits. We grouped those industries into the seven layers above, with Amkor moved next to ASE as outsourced packaging. Holdings that came back without a CIK, mostly listings outside the U.S. such as SK hynix in Seoul, Samsung Electronics, MediaTek, and Tokyo Electron, were classified by name, and every mapped company name was checked against the holding's own name before its industry was used. Cash, Treasury bills, money market funds, and securities-lending collateral are excluded, so each layer is a share of net assets.
Step 3: fees, flows, and prices
/api/fund/fees returns each fund's fee table from its prospectus filings with the accession number, /api/fund/profile returns net assets plus monthly sales and redemptions from each N-PORT report, and /api/price/history returns dividend-adjusted daily closes for the returns.
Semiconductor ETF holdings: designers, memory, fabs, or equipment
Sorted from the most processor-heavy to the least, the ten funds look like ten different bets:
PSI is the equipment fund: 46.6% of its net assets sat in equipment and materials makers on July 31, 2026, from Applied Materials, KLA, and Lam Research to Ichor, Cohu, and Ultra Clean. At the other end, XSD and SMHX hold no equipment makers at all. SMHX is 55.5% processors and 16.7% chip IP and design software, by design. XSD is 39.9% analog and power, and its gray Other segment is solar module makers (First Solar, T1 Energy), display technology (Universal Display, Kopin), Penguin Solutions, and Rigetti Computing.
SMH and SOXX look alike at this level: 39.5% and 37.6% processors, 23.2% and 24.0% equipment. The difference is inside the layers. Nvidia was 17.55% of SMH and 6.81% of SOXX, and TSMC 9.29% and 4.26%. Foundries and equipment together, the manufacturing side of the chain, run from 51.2% of PSI and 32.5% of SMH down to 1.5% of XSD and zero for SMHX and DRAM.
Two funds reach beyond chips. CHPX keeps 15.2% in companies around the chips: Cisco, Arista, Vertiv, Hewlett Packard Enterprise, Nebius, CoreWeave, server makers, and four quantum computing companies. And DRAM is 99.9% memory and storage once its swaps are counted, which gets its own section below.
How current are these holdings?
N-PORT reports become public quarterly. These were filed 52 to 61 days after their report dates, so the oldest here, CHPS's from May 29, 2026, is almost five months old. All ten funds also publish a daily holdings file, which /api/fund/holdings/daily serves on the ETF and Pro plans. The same classification run on the October 20 to 22 files:
| Fund | Largest layer, N-PORT | Largest layer, daily file | Biggest single-layer move |
|---|---|---|---|
| SMH | Processors, GPUs, and logic 39.5%, Jun 30, 2026 | Processors, GPUs, and logic 41.0%, Oct 20, 2026 | Equipment and materials 23.2% to 17.9% |
| SOXX | Processors, GPUs, and logic 37.6%, Jun 30, 2026 | Processors, GPUs, and logic 42.0%, Oct 20, 2026 | Equipment and materials 24.0% to 16.5% |
| DRAM | Memory and storage 99.9%, Jun 30, 2026 | Memory and storage 99.8%, Oct 22, 2026 | Memory and storage 99.9% to 99.8% |
| XSD | Analog and power 39.9%, Jun 30, 2026 | Analog and power 42.8%, Oct 20, 2026 | Analog and power 39.9% to 42.8% |
| FTXL | Processors, GPUs, and logic 39.0%, Jun 30, 2026 | Processors, GPUs, and logic 33.6%, Oct 20, 2026 | Analog and power 15.6% to 24.6% |
| SOXQ | Processors, GPUs, and logic 40.3%, May 31, 2026 | Processors, GPUs, and logic 39.3%, Oct 20, 2026 | Memory and storage 11.8% to 7.7% |
| PSI | Equipment and materials 46.6%, Jul 31, 2026 | Equipment and materials 41.5%, Oct 20, 2026 | Analog and power 17.2% to 31.1% |
| SMHX | Processors, GPUs, and logic 55.5%, Jun 30, 2026 | Processors, GPUs, and logic 58.4%, Oct 20, 2026 | Processors, GPUs, and logic 55.5% to 58.4% |
| CHPX | Processors, GPUs, and logic 35.0%, May 31, 2026 | Processors, GPUs, and logic 39.1%, Oct 21, 2026 | Processors, GPUs, and logic 35.0% to 39.1% |
| CHPS | Processors, GPUs, and logic 28.3%, May 29, 2026 | Processors, GPUs, and logic 29.5%, Oct 20, 2026 | Equipment and materials 24.3% to 27.5% |
The profiles held up, but some moved. In PSI, analog and power rose from 17.2% to 31.1%, while equipment stayed its largest layer at 41.5%. In SOXX, equipment fell from 24.0% to 16.5%. Nvidia grew to 20.44% of SMH. CHPS's index dropped its ESG screen effective July 7, 2026 (supplement 0000088053-26-000512), so its May 29, 2026 filing predates that change. The quarterly filing stays the audit trail; the daily file shows where a fund sits today, as our look at how often ETF holdings change explains.
Best semiconductor ETFs 2026, fund by fund
The best semiconductor ETF depends on which layer you want to own and how much single-stock concentration you accept. Here is each fund from its latest filings, largest first:
| Fund | Net assets | Holdings | Top 10 | Nvidia | Expense ratio | 2026 YTD | Largest layer |
|---|---|---|---|---|---|---|---|
| SMH | $77.20B | 25 | 70.2% | 17.5% | 0.35% | +54.6% | Processors, GPUs, and logic 39.5% |
| SOXX | $47.82B | 30 | 61.6% | 6.8% | 0.33% | +69.8% | Processors, GPUs, and logic 37.6% |
| DRAM | $25.91B | 12 | 98.9% | 0.0% | 0.65% | n/a | Memory and storage 99.9% |
| XSD | $3.48B | 47 | 29.0% | 2.1% | 0.35% | +50.0% | Analog and power 39.9% |
| FTXL | $2.75B | 34 | 67.3% | 4.8% | 0.60% | +76.3% | Processors, GPUs, and logic 39.0% |
| SOXQ | $2.43B | 30 | 63.0% | 8.9% | 0.19% | +62.8% | Processors, GPUs, and logic 40.3% |
| PSI | $2.38B | 30 | 49.4% | 5.5% | 0.55% | +63.8% | Equipment and materials 46.6% |
| SMHX | $297.0M | 22 | 71.8% | 18.6% | 0.35% | +47.1% | Processors, GPUs, and logic 55.5% |
| CHPX | $257.6M | 36 | 70.6% | 6.0% | 0.50% | +67.1% | Processors, GPUs, and logic 35.0% |
| CHPS | $89.6M | 52 | 49.4% | 3.4% | 0.15% | +70.2% | Processors, GPUs, and logic 28.3% |
Net assets, holdings, and weights from each fund's latest N-PORT report (DRAM's swaps at notional). 2026 YTD is the total return from the December 31, 2025 close to Oct 21, 2026; DRAM launched on April 2, 2026.
Tracks the MVIS US Listed Semiconductor 25 Index. The index takes the 50 largest semiconductor stocks by full market capitalization and keeps the top 25 by free-float market capitalization and trading volume, U.S.-listed shares and depositary receipts only.
Top holdings: Nvidia 17.5%, TSMC 9.3%, Applied Materials 5.7%. Expense ratio 0.35%.
Closest fit: The default large-cap chip fund, and the most concentrated: Nvidia and TSMC alone were 26.8% of it.
Tracks the NYSE Semiconductor Index: the 30 largest U.S.-listed companies in the semiconductors industry under ICE's classification, which also counts equipment, packaging, and testing companies.
Top holdings: Micron 8.5%, AMD 8.1%, Nvidia 6.8%. Expense ratio 0.33%.
Closest fit: The same large caps with less Nvidia: Micron, AMD, Nvidia, Intel, and Broadcom each sat between 6% and 9% on Jun 30, 2026.
Actively managed. Its prospectus defines memory companies as those with at least 50% of revenue or profit from products such as HBM, DRAM, NAND flash and SSDs, NOR flash, and hard disk drives, caps any single company at 25%, and allows swaps to reach them.
Top holdings: Micron 25.8%, Samsung Electronics 25.0%, SK hynix 24.0%. Expense ratio 0.65%.
Closest fit: Memory and storage only: Micron, Samsung, and SK hynix near a quarter each, with flash and disk makers in the rest.
Tracks the S&P Semiconductor Select Industry Index, drawn from the semiconductor segment of a U.S. total market index. Its prospectus says the index “is modified equal weighted.”
Top holdings: MaxLinear 3.8%, Allegro MicroSystems 3.3%, Astera Labs 3.1%. Expense ratio 0.35%.
Closest fit: Small and mid-cap chip designers with no equipment makers: the largest holding was 3.75% and Nvidia 2.10%.
Tracks the Nasdaq US Smart Semiconductor Index, which picks the 30 to 50 top factor-ranked U.S. semiconductor and chip equipment companies.
Top holdings: Intel 13.3%, Micron 12.1%, Marvell 7.9%. Expense ratio 0.60%.
Closest fit: Factor-ranked, and heavy in Intel (13.28%) and Micron (12.14%) in its June filing.
Tracks the PHLX Semiconductor Index, a modified market-capitalization weighted index of the 30 largest U.S.-listed semiconductor companies.
Top holdings: Micron 11.8%, Nvidia 8.9%, Broadcom 8.7%. Expense ratio 0.19%.
Closest fit: The 30 largest U.S.-listed chip stocks for 0.19%, the lowest fee here after CHPS.
Tracks the Dynamic Semiconductor Intellidex Index: 30 U.S. semiconductor companies, including makers of chip production equipment and services.
Top holdings: Applied Materials 6.5%, AMD 5.5%, Nvidia 5.5%. Expense ratio 0.55%.
Closest fit: The equipment-heavy choice: 46.6% in equipment and materials makers on Jul 31, 2026.
Tracks the MarketVector US Listed Fabless Semiconductor Index: U.S.-listed chip designers that outsource manufacturing. Its prospectus says the index “does not currently include companies engaged in the production of equipment used in the manufacturing of semiconductors.”
Top holdings: Nvidia 18.6%, Broadcom 14.2%, Astera Labs 6.1%. Expense ratio 0.35%.
Closest fit: Designers and design tools only: no foundries or equipment, and 16.7% in Arm, Cadence, Synopsys, and Rambus.
Tracks the Global X AI Semiconductor & Quantum Index, which covers AI semiconductors, compute system enablers, data center infrastructure, and quantum computing companies.
Top holdings: Micron 9.8%, SK hynix 9.2%, ASML 8.1%. Expense ratio 0.50%.
Closest fit: Chips plus the AI hardware around them: 15.2% in networking, server, power and cooling, cloud, and quantum computing companies.
Tracks the Solactive Semiconductor Focus Index: the 50 largest semiconductor companies worldwide by free-float market capitalization, excluding listings in China, Egypt, India, Pakistan, and Russia. The index dropped its ESG screen in July 2026.
Top holdings: Micron 6.8%, SK hynix 6.8%, AMD 6.5%. Expense ratio 0.15%.
Closest fit: The cheapest (0.15%) and the most global: SK hynix, MediaTek, and Tokyo Electron sit next to the U.S. names.
None of this is a recommendation. A fund that matches the layer you want can still be wrong for your portfolio, and every number here is a snapshot with a date on it.
SMH vs SOXX: overlap and Nvidia concentration
SMH and SOXX share 23 companies, and 73.9% of the two portfolios is identical by weight. 96.0% of SMH and 91.9% of SOXX sit in names the other fund also holds. Owning both mostly doubles the same bet. What differs is concentration: SMH's top 10 holdings are 70.2% of the fund against 61.6% for SOXX, and Nvidia's weight is about two and a half times larger in SMH.
| SMH | SOXX | SOXQ | FTXL | CHPS | PSI | XSD | SMHX | CHPX | DRAM | |
|---|---|---|---|---|---|---|---|---|---|---|
| SMH | · | 74 | 69 | 59 | 63 | 44 | 27 | 44 | 54 | 6 |
| SOXX | 74 | · | 82 | 70 | 64 | 48 | 36 | 34 | 49 | 9 |
| SOXQ | 69 | 82 | · | 73 | 65 | 40 | 35 | 41 | 52 | 12 |
| FTXL | 59 | 70 | 73 | · | 58 | 45 | 35 | 30 | 42 | 12 |
| CHPS | 63 | 64 | 65 | 58 | · | 37 | 28 | 24 | 52 | 14 |
| PSI | 44 | 48 | 40 | 45 | 37 | · | 30 | 23 | 22 | 5 |
| XSD | 27 | 36 | 35 | 35 | 28 | 30 | · | 35 | 20 | 3 |
| SMHX | 44 | 34 | 41 | 30 | 24 | 23 | 35 | · | 36 | 0 |
| CHPX | 54 | 49 | 52 | 42 | 52 | 22 | 20 | 36 | · | 19 |
| DRAM | 6 | 9 | 12 | 12 | 14 | 5 | 3 | 0 | 19 | · |
The closest pair is not SMH and SOXX. SOXX and SOXQ are 82.4% identical, even though they track different indexes, the NYSE Semiconductor Index and the PHLX Semiconductor Index, and SOXQ charges 0.19% against 0.33%. DRAM sits apart from everything: its largest overlap is 19.0%, with CHPX, and with SMH it shares only Micron (5.7%).
/api/fund/overlap runs this comparison for any two funds in one call, here SMH against SOXX, trimmed to the summary and the first two rows:
curl "https://api.stockfit.io/v1/api/fund/overlap?symbol1=SMH&symbol2=SOXX" \
-H "Authorization: Bearer $STOCKFIT_API_KEY"{
"symbol1": "SMH",
"symbol2": "SOXX",
"reportDate1": "2026-06-30",
"reportDate2": "2026-06-30",
"overlapCount": 23,
"onlyIn1Count": 3,
"onlyIn2Count": 9,
"overlapWeight1": 96.004993956511,
"overlapWeight2": 91.858016077078,
"holdings": [
{
"cusip": "67066G104",
"name": "NVIDIA Corp",
"mappedSymbol": "NVDA",
"weight1": 17.54859673435,
"weight2": 6.81135644593,
"overlapStatus": "both"
},
{
"cusip": "595112103",
"name": "Micron Technology Inc",
"mappedSymbol": "MU",
"weight1": 5.673780881653,
"weight2": 8.544235842935,
"overlapStatus": "both"
}
]
}The endpoint matches holdings on CUSIP, and for this pair its counts agree with the matrix exactly. For pairs where the same company is held through two different listings, such as ASML in SOXX and SOXQ or TSMC in SMH and CHPS, we matched by company using the CIK from /api/fund/holdings instead.
Inside DRAM, the memory ETF: swaps, Samsung, and SK hynix
DRAM is the newest fund here and the one that drew the most money. The Roundhill Memory ETF closed its first day, April 2, 2026, at $27.76, and by June 30, 2026 its N-PORT reported net assets of $25.91 billion after $19,961 million of net creations in its first quarter. It is actively managed, charges 0.65%, and its prospectus caps any single company at 25%.
Its June 30 filing lists 18 positions: 12 memory and storage stocks worth 57.3% of net assets, a Treasury bill worth 21.4%, a government money market fund worth 14.2%, and four total return swaps. The swaps carry $11.03B of notional exposure, 42.6% of net assets:
| Reference stock | Counterparty | Notional | % of net assets | Ends |
|---|---|---|---|---|
| Micron | Nomura Securities International | $3.72B | 14.36% | 2027-05-04 |
| Micron | Goldman Sachs & Co. | $2.44B | 9.43% | 2027-05-24 |
| SK hynix | Goldman Sachs & Co. | $2.10B | 8.10% | 2027-05-24 |
| Samsung Electronics | Goldman Sachs & Co. | $2.76B | 10.66% | 2027-05-24 |
Total return swaps in the derivatives section of DRAM's N-PORT for June 30, 2026, accession 0000894189-26-023623.
Valued at notional, the way DRAM's prospectus measures its 80% memory policy, the three largest exposures land near the 25% cap, and most of the Micron position is a swap:
Only 2.03% of DRAM's net assets were Micron shares; another 23.79% came through two swaps with Nomura and Goldman Sachs. Samsung (14.37% shares, 10.66% swap) and SK hynix (15.89% shares, 8.10% swap) also mix shares and a swap. Roundhill's fund page gives the reason: “The Fund utilizes total return swaps in order to maintain compliance with RIC diversification tests.” Those tests sit in section 851(b)(3) of the Internal Revenue Code: at the close of each quarter, at least half of a fund's assets must be cash, government securities, shares of other funds, and positions of 5% or less, and no more than 25% can sit in any one issuer. Three companies at about a quarter of the fund each, all held as shares, would leave room for at most a quarter in that first group.
When we pulled this data, /api/fund/holdings returned DRAM's 14 direct positions but not the four swaps, so the swap figures above come from the filing on EDGAR itself. The daily file lists them as positions. On October 22, 2026, DRAM's file at /api/fund/holdings/daily showed Micron at 27.97% of net assets (24.63% through swaps), Samsung at 26.01%, SK hynix at 20.70%, and a new 4.69% swap on CXMT, the Chinese DRAM maker that listed on Shanghai's STAR Market in July 2026. Our leveraged ETF rebalancing teardown shows how to read swap rows like these in daily holdings files.
DRAM peaked at $80.72 on June 22, 2026 and closed at $49.16 on October 21, 2026: +77.1% from its first close and -39.1% from the high.
Semiconductor ETF expense ratios and fund flows
Expense ratios come from each fund's prospectus fee table, the legal disclosure, not a fact sheet:
| Fund | Expense ratio | Filed | Accession |
|---|---|---|---|
| CHPS | 0.15% | 2026-09-25 | 0000088053-26-000768 |
| SOXQ | 0.19% | 2025-12-18 | 0001104659-25-122454 |
| SOXX | 0.33% | 2026-07-27 | 0001193125-26-318131 |
| SMH | 0.35% | 2026-01-27 | 0001137360-26-000029 |
| XSD | 0.35% | 2025-10-24 | 0001193125-25-250041 |
| SMHX | 0.35% | 2026-01-27 | 0001137360-26-000029 |
| CHPX | 0.50% | 2026-03-28 | 0001432353-26-000311 |
| PSI | 0.55% | 2026-08-27 | 0001104659-26-102475 |
| FTXL | 0.60% | 2026-07-29 | 0001445546-26-005539 |
| DRAM | 0.65% | 2026-04-02 | 0001398344-26-005950 |
SOXX's latest row from /api/fund/fees, trimmed:
{
  "filedDate": "2026-07-27",
  "accessionNumber": "0001193125-26-318131",
  "symbol": "C000012084",
  "managementFee": 0.0033,
  "otherExpenses": 0,
  "totalExpenseRatio": 0.0033
}
SOXX has cut its fee five times since 2021: from 0.46% to 0.43% in July 2021, then to 0.40% in July 2022, 0.35% in December 2022, 0.34% in July 2025, and 0.33% in July 2026. SMH's fee tables have shown a net 0.35% in every filing since 2020. The four most expensive funds, CHPX, PSI, FTXL, and DRAM, charge 0.50% to 0.65%.
Net creations, N-PORT sales minus redemptions, over each fund's latest reported quarters:
DRAM took in more money in one quarter than SMH and SOXX combined over four: $19,961 million against $9,174 million and $8,277 million. The two giants grew anyway. SMH's net assets rose from $26.36 billion on June 30, 2025 to $77.20 billion a year later, and SOXX's from $13.55 billion to $47.82 billion, mostly from rising prices. Our guide to ETF fund flows from N-PORT covers how these figures are built.
Semiconductor ETF performance: 2023 to 2026
| Fund | 2023 | 2024 | 2025 | 2026 YTD | From 2026 high |
|---|---|---|---|---|---|
| FTXL | +54.4% | +7.6% | +48.9% | +76.3% | -23.1% |
| CHPS | n/a | +7.7% | +58.5% | +70.2% | -25.3% |
| SOXX | +67.1% | +12.9% | +40.7% | +69.8% | -22.0% |
| CHPX | n/a | n/a | n/a | +67.1% | -17.6% |
| PSI | +49.1% | +17.2% | +36.3% | +63.8% | -31.3% |
| SOXQ | +66.7% | +20.2% | +43.1% | +62.8% | -21.3% |
| SMH | +73.4% | +39.1% | +49.2% | +54.6% | -16.8% |
| XSD | +34.9% | +10.8% | +29.8% | +50.0% | -25.8% |
| SMHX | n/a | n/a | +30.0% | +47.1% | -17.6% |
| DRAM | n/a | n/a | n/a | +77.1%* | -39.1% |
Total return from dividend-adjusted closes through Oct 21, 2026, from /api/price/history; n/a where a fund had not launched. *DRAM: from its first close on Apr 2, 2026.
Through October 21, 2026, FTXL leads 2026 at +76.3% and SMHX trails at +47.1%. The top and the bottom line up with the stock table: FTXL held the most Intel and Micron of the index funds, while SMHX and SMH held the most Nvidia plus Broadcom. XSD, the other laggard, is equal weighted and held no equipment makers. All ten set their 2026 highs in June, seven of them on June 22, 2026, and they now sit 16.8% (SMH) to 39.1% (DRAM) below those highs.
Earlier years had different leaders. SMH led in 2023 (+73.4%) and again in 2024 (+39.1%), CHPS led in 2025 (+58.5%), and 2026 so far has favored the funds with more memory and Intel. Four years of ten funds is an observation, not a pattern to trade on, and past returns say nothing about the next year.
Pull semiconductor ETF holdings with the API
The classification above starts with one short script. It pulls a fund's latest N-PORT holdings, looks up the SFIC industry for every mapped company, and sums the weights:
const BASE = 'https://api.stockfit.io/v1/api';
const headers = { Authorization: `Bearer ${process.env.STOCKFIT_API_KEY}` };

async function get(path) {
  const res = await fetch(`${BASE}${path}`, { headers });
  if (!res.ok) throw new Error(`${res.status} on ${path}`);
  return res.json();
}

const symbol = process.argv[2] ?? 'SMH';
const { reportDate, data } = await get(`/fund/holdings?symbol=${symbol}&pageSize=1000`);

const industryByCik = new Map();
const weightByIndustry = {};
for (const h of data) {
  if (h.assetCat !== 'EC') continue; // equities only: skips cash, T-bills, and lending collateral
  let industry = 'No SEC registrant (classify by name)';
  if (h.mappedCik) {
    if (!industryByCik.has(h.mappedCik)) {
      const company = await get(`/company/details?cik=${h.mappedCik}`);
      industryByCik.set(h.mappedCik, company.industry);
    }
    industry = industryByCik.get(h.mappedCik);
  }
  weightByIndustry[industry] = (weightByIndustry[industry] ?? 0) + h.pctVal;
}

console.log(`${symbol}, N-PORT report date ${reportDate}`);
for (const [industry, weight] of Object.entries(weightByIndustry).sort((a, b) => b[1] - a[1])) {
  console.log(`${weight.toFixed(1).padStart(5)}%  ${industry}`);
}
Saved as chip-layers.mjs and run with Node 18 or newer as node chip-layers.mjs XSD on October 22, 2026, it prints:
XSD, N-PORT report date 2026-06-30
 28.7%  Processors, Logic & Digital ICs
 27.4%  Analog, Mixed-Signal & Microcontrollers
 12.5%  Power Semiconductors & Discretes
 10.8%  RF & Wireless Semiconductors
  4.6%  Solar Energy
  3.3%  Memory & Storage Semiconductors
  3.2%  Displays & Display Materials
  3.0%  Semiconductor & Chip Design IP
  2.7%  Servers & Enterprise Systems
  2.1%  Quantum Computing
  1.5%  Semiconductors
That is the equal-weight fund from the chart, with its solar, display, server, and quantum computing names showing up as their own industries. The bare Semiconductors line is the broad bucket where SFIC keeps the foundries, SkyWater here. Change the symbol to profile any fund. For a swap-based fund like DRAM, read /api/fund/holdings/daily, which lists the swaps as positions. To find every fund that holds one chip stock, the reverse ETF lookup walkthrough covers /api/fund/reverse-lookup, and the ETF data API lists all 22 fund endpoints, from fees and flows to overlap. A covers /api/fund/profile, /api/company/details, and /api/price/history; holdings are on the Starter, ETF, and Pro plans. Every N-PORT and prospectus cited here is also on SEC EDGAR by its accession number.
FAQ
Q.What is the best semiconductor ETF in 2026?
Q.What is the difference between SMH and SOXX?
Q.How much do SMH and SOXX overlap?
Q.What does the DRAM ETF hold?
Q.Why does the DRAM ETF use swaps?
Q.Which semiconductor ETF has the lowest expense ratio?
Q.Is there an equal-weight semiconductor ETF?
Q.Is there a Vanguard semiconductor ETF?
Q.How can I get semiconductor ETF holdings through an API?
Ready to build?
Free API key, no credit card.