Best Memory ETFs 2027: What Each One Holds
Best memory ETFs 2027 compared by holdings: DRAM, KMEM, DISK and HBMX split into shares, total return swaps, options and Treasury bills, from SEC filings.
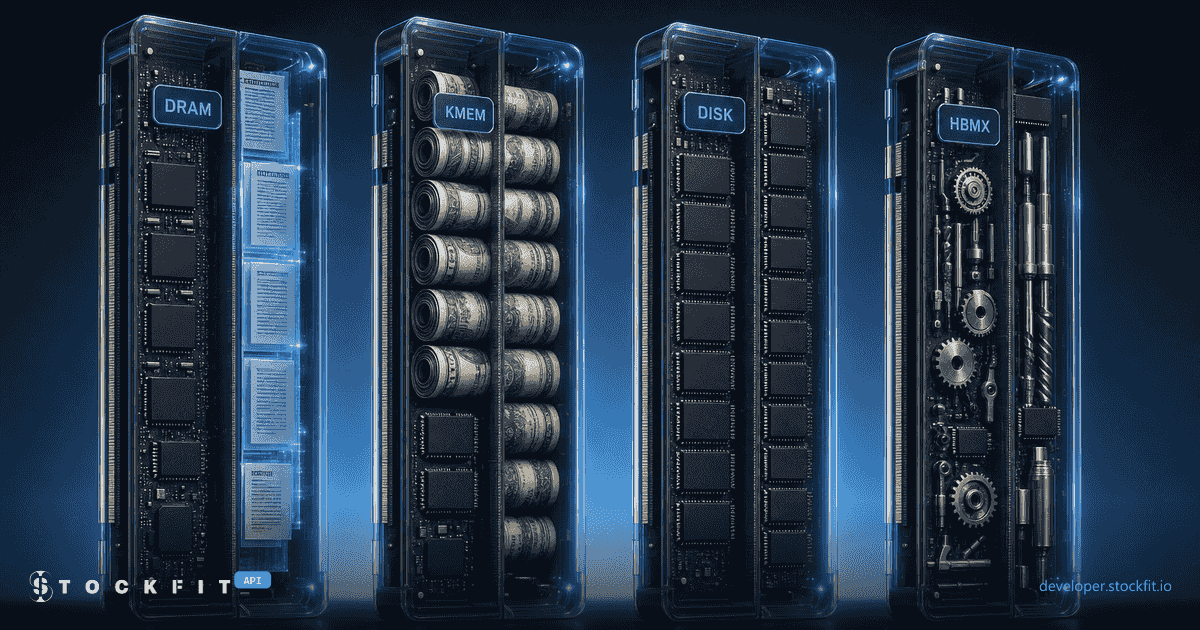
Search for the best memory ETFs for 2027 and the lists name the same four funds: DRAM, KMEM, DISK and HBMX. All four carry memory in the name, and most comparisons stop at the top holdings and the expense ratio. Read the holdings files line by line and they turn out to be four different instruments.
Micron is 27.51% of DRAM, the largest of the four, yet Micron stock is 1.08% of the fund. The rest sits in two total return swaps. KMEM holds two stocks, keeps 91.83% of its net assets in Treasury bills and a money market fund, and gets about half of its exposure from options on DRAM, the ETF it competes with.
This post splits each fund into shares, swaps, options and cash, using the issuer's own daily holdings file as served by /api/fund/holdings/daily, captured on November 14, 2026. Every figure names its file date, and the SEC filings behind the fees and KMEM's option schedule are linked. The files are from November 2026, so read this as where each fund stands going into 2027. It is data about what the funds hold, not investment advice.
Best memory ETFs 2027: the four funds at a glance
A memory ETF is a thematic ETF, narrower than a semiconductor ETF. It holds memory stocks, the companies that make memory chips (DRAM and NAND flash), and sometimes the memory supply chain around them. The case made for these funds is the memory bottleneck in AI infrastructure: AI data centers need high-bandwidth memory (HBM), which only SK hynix, Samsung Electronics and Micron Technology make in volume, and two of those three trade in South Korea, not on U.S. exchanges. That access is what a pure-play memory fund sells.
DRAMRoundhill Memory ETF
The three HBM makers, held as local shares plus swaps.
- Holds memory through
- 54% shares, 46% total return swaps
- Expense ratio
- 0.65%
- Net assets
- $15.35 billion
- Micron, Samsung, SK hynix
- 77.2%
Roundhill, Cboe BZX, launched April 2026. Daily file dated 2026-11-16.
KMEMKurv Memory Select ETF
Two stocks, option pairs and Treasury bills.
- Holds memory through
- 29% shares, 71% options
- Expense ratio
- 0.65%
- Net assets
- $15.9 million
- Micron, Samsung, SK hynix
- 44.1%
Kurv, Cboe BZX, launched June 2026. Daily file dated 2026-11-12.
DISKTema Memory ETF
NAND flash and storage tilt, held as shares.
- Holds memory through
- 93% shares, 6% total return swaps
- Expense ratio
- 0.75%
- Net assets
- $47.7 million
- Micron, Samsung, SK hynix
- 33.3%
Tema, NYSE Arca, launched June 2026. Daily file dated 2026-11-13.
HBMXTuttle Capital Concentrated Memory Stack ETF
Equipment, test and packaging around the memory makers.
- Holds memory through
- 95% shares, 4% total return swaps
- Expense ratio
- 0.95%
- Net assets
- $17.5 million
- Micron, Samsung, SK hynix
- 15.3%
Tuttle Capital, Cboe BZX, launched June 2026. Daily file dated 2026-11-13.
DRAM is the category. Its daily file adds up to $15.35 billion of net assets, against $81.2 million for the other three combined, which makes it 99.5% of the assets in these four funds. Its N-PORT for June 30, 2026 (accession 0000894189-26-023623) reported $25.91 billion.
Memory is a cyclical business and the funds have traded like one. DRAM closed at $80.72 on June 22, 2026 and at $42.40 on November 13, 2026, down 47.5%, though still 52.7% above its first close since inception on April 2, 2026. The three funds that launched in June, near that peak, are down 32% to 52% from their first closes.
Read the cards as profiles, not a ranking. Concentration risk differs as much as the fee does: Micron, Samsung and SK hynix are 77.2% of DRAM and 15.3% of HBMX.
Memory ETF holdings: shares, swaps, options or Treasury bills
A fund can get exposure to a memory maker in three ways. It can own the shares, as the local listing or as depositary receipts (ADRs). It can enter a total return swap, a contract in which a bank pays the stock's return and the fund pays a financing rate. Or it can buy a call and write a put at the same strike, a pair that behaves like owning the stock. Swaps and options need little cash up front, so the rest of the money sits in Treasury bills and money market funds, part of it as collateral. A daily holdings file shows all of this, because each instrument is its own row.
The method is short. Each row is classified by how the issuer names it: a swap row says SWAP or TRS, an option row carries an option symbol, a bill says Treasury Bill. Swaps count at the weight the issuer reports, which is notional. KMEM's option pairs count at contracts times 100 times the underlying's close on the file date, the way the fund's own N-PORT schedule states a notional amount.
Two funds are mostly physical and two are not. DISK holds 92.7% in shares and HBMX 94.7%, each with a single swap. DRAM gets 46.0% of its exposure from swaps, and KMEM gets 71.2% from options. Adding instruments together like this is look-through exposure, and the issuers do it too: the top holdings table on Roundhill's DRAM page notes that its weight calculation “combines stock position with position held via total return swaps.”
DRAM ETF holdings: Micron through total return swaps
Ask the API for DRAM's daily file and Micron appears three times. These are three of the 27 rows, fields as returned:
curl "https://api.stockfit.io/v1/api/fund/holdings/daily?symbol=DRAM&pageSize=1000" \
-H "Authorization: Bearer $STOCKFIT_API_KEY"{
"reportDate": "2026-11-16",
"totalResults": 27,
"data": [
{
"name": "MICRON TECHNOLOGY INC SWAP NM",
"ticker": "595112103 TRS 050427 NM",
"cusip": "595112103 TRS 050427 NM",
"balance": 2799228,
"units": "NS",
"currency": "USD",
"valueUsd": 2178667144.68,
"pctVal": 14.2
},
{
"name": "MICRON TECHNOLOGY, INC.-SWAP-GOLD-L",
"ticker": "595112103 TRS 052427 GS",
"cusip": "595112103 TRS 052427 GS",
"balance": 2412407,
"units": "NS",
"currency": "USD",
"valueUsd": 1877600492.17,
"pctVal": 12.23
},
{
"name": "Micron Technology Inc",
"ticker": "MU",
"cusip": "595112103",
"balance": 212537,
"units": "NS",
"currency": "USD",
"valueUsd": 165419672.47,
"pctVal": 1.08
}
]
}The two swap rows carry 26.43% of the fund in Micron exposure. The stock row carries 1.08%. Samsung and SK hynix are the reverse: mostly local shares in Seoul (19.51% and 15.22%), topped up with one swap each (7.92% and 6.33%), plus 0.73% in SK hynix's depositary receipts, which began trading on Nasdaq under the ticker SKHY in July 2026. A fifth swap, 5.28%, references CXMT, a Chinese memory maker that appears only as a swap in each of the three files that hold it.
Why swaps? Roundhill answers on its fund page: “The Fund utilizes total return swaps in order to maintain compliance with RIC diversification tests.” A regulated investment company has to keep its large single-issuer positions within limits at each quarter end, and a fund built around three companies cannot hold all three outright at these weights. The swap rows are how an actively managed fund keeps 77.2% in three names and still qualifies.
The cost of that structure is in the same file. Swaps add up to 45.96% of net assets, and 59.31% of net assets sits in 6 Treasury bills, a government money market fund and small currency balances. A swap also carries counterparty risk that a share does not: the exposure is a bank's promise to pay.
The split moves from day to day. /api/fund/holdings/daily/history returns the weights across the retained files in one call. Over the 33 files dated October 1, 2026 to November 16, 2026, the Micron stock line peaked at 4.63%, while the two Micron swaps together stayed between 22.43% and 26.83%. The swaps are the position and the stock line is the adjustment.
One note on dates: Roundhill stamps each file with the next trading day. The file dated November 16, 2026 carries November 13, 2026 closing values, which you can check on the Micron stock row: $165,419,672 over 212,537 shares is $778.31, Micron's close on November 13, 2026. The fund's June 30 filing showed the same structure, covered in the DRAM section of our semiconductor ETF comparison.
KMEM: options, Treasury bills and a position in DRAM
KMEM's file dated November 12, 2026 has 13 rows. Two are stocks: SK hynix at 21.65% and Samsung at 7.40%. Three are Treasury bills worth 86.31% of net assets, and a money market fund adds 5.52%. The rest, apart from a cash line, are three option pairs:
- DRAM49.13%
1,794 contracts, $55 strike, expires 12/18/2026, close $43.66
- MU15.02%
30 contracts, $930 strike, expires 12/18/2026, close $798.44
- SNDK7.06%
12 contracts, $1,570 strike, expires 12/18/2026, close $937.46
| Underlying | Contracts | Strike | Expires | Close | Exposure |
|---|---|---|---|---|---|
| DRAM | 1,794 | $55 | 12/18/2026 | $43.66 | 49.13% |
| MU | 30 | $930 | 12/18/2026 | $798.44 | 15.02% |
| SNDK | 12 | $1,570 | 12/18/2026 | $937.46 | 7.06% |
Each line is a purchased call paired with a written put on the same contracts, strike and expiry. Exposure is contracts x 100 x the underlying's close on November 12, 2026, as a percent of KMEM's net assets. Rows from /api/fund/holdings/daily, closes from /api/price/history.
KMEM's largest position is the fund it competes with. At the November 12, 2026 close, the DRAM pair is worth 49.13% of KMEM's net assets in exposure, more than its two stocks combined.
None of this is hidden. The KMEM summary prospectus says the fund may gain exposure through “the shares of other ETFs that invest in the securities of, or derivative instruments relating to, Memory Companies,” and that it “will look through to a Memory Company ETF's underlying holdings” for its 80% policy. It explains the bills as well: derivatives can be bought “with a fraction of the assets” the stocks would need, and the remainder may go into fixed income.
The SEC filing shows the same structure three months earlier. KMEM's schedule of investments for August 31, 2026 (accession 0001193125-26-440715) lists common stocks at 28.3% of net assets, Treasury bills at 64.7%, and call options on “Roundhill Memory ETF” with a notional amount of $13,428,400, which is 48.8% of its $27.5 million of net assets, against written puts at the same $52 strike. $10.5 million of the bills was pledged as collateral for the written options.
For a comparison this matters in two ways. A table that lists KMEM as SK hynix, Micron and Samsung describes the end exposure and says nothing about the instrument. And through the DRAM pair, KMEM also sits on top of DRAM's own swaps.
DISK and HBMX: physical shares, different memory
The two funds that hold mostly shares differ on a separate question: which part of memory they own. Put the three HBM makers side by side and the four funds separate cleanly.
DISK is the NAND flash and data storage fund. It holds 92.70% in shares across 16 stock lines, one CXMT swap at 6.42% and 0.90% in cash. Sandisk and Kioxia, both flash memory makers, are 28.34% of the fund, against 5.71% of DRAM. The three HBM makers are 33.27%, led by SK hynix.
HBMX owns the memory ecosystem more than the memory makers. Grouping its 24 positions by what each company does (the grouping is ours, the weights are the file's):
- Memory and storage makers: 28.56%
- Equipment, test and packaging: 55.43%
- Modules, controllers and interface chips: 14.91%
Its largest line after Micron is Advantest, which makes chip test equipment. Every stock line in the file trades in the U.S., as a domestic listing or a depositary receipt, SK hynix included (5.38% in SKHY). Samsung Electronics, which has no U.S. listing, is not in the file. If the thesis is the pricing power of the companies whose HBM is in short supply, most of HBMX is a different bet: the companies that sell to them.
Leveraged and income memory ETFs are a different product
Six more funds trade on the memory theme and do not belong in the same table. Each one had a closing price on November 13, 2026:
| Ticker | Fund | Type | Exchange |
|---|---|---|---|
| RAM | Roundhill T-Rex 2X Long DRAM Daily Target ETF | 2x long, daily, on DRAM | Cboe BZX |
| DRAL | Defiance Daily Target 2x Long Dram ETF | 2x long, daily, on DRAM | Cboe BZX |
| RAMZ | EOT T-REX 2X Inverse DRAM Daily Target ETF | 2x inverse, daily, on DRAM | Cboe BZX |
| DRMY | XFUNDS Memory Income ETF | Income | NYSE Arca |
| DRMP | Tuttle Capital Memory Stack Income Blast ETF | Income | Cboe BZX |
| YRAM | YieldMax Memory and Storage Portfolio Option Income ETF | Option income | Nasdaq |
The leveraged funds are built from swaps alone. RAM's daily file dated November 12, 2026 is one cash line at 105.39% of net assets and 5 swap legs on DRAM adding up to 210.87%: twice the fund, reset every day. What that reset does to returns over more than one day is the subject of our leveraged ETF rebalancing walkthrough. The income funds are built to pay distributions. DRMY's daily file, for example, holds memory stocks alongside options on DRAM. Neither kind is a substitute for the four funds above, and neither should be ranked against them on yield or on a few months of returns.
How to check any ETF for swap exposure
The comparison above is one request per fund and a classifier of about twenty lines. This script, for Node 18 or later, prints the reported weight per instrument for each fund:
const BASE = 'https://api.stockfit.io/v1/api/fund';
const headers = {Authorization: `Bearer ${process.env.STOCKFIT_API_KEY}`};

// Reads the instrument from how the issuer names the row.
function instrumentOf(row) {
  const label = `${row.name} ${row.ticker ?? ''}`;
  if (/\b(SWAP|TRS)\b/i.test(label)) {
    return 'swap';
  }
  if (/\d{6}[CP]\d{8}$/.test(row.ticker ?? '')) {
    return 'option';
  }
  if (/treasury bill/i.test(row.name)) {
    return 'treasury';
  }
  if (/government obligations|mmkt|money market/i.test(row.name)) {
    return 'moneyMarket';
  }
  if (/cash/i.test(row.name) || row.cusip?.startsWith('CASH')) {
    return 'cash';
  }
  return 'shares';
}

for (const symbol of ['DRAM', 'KMEM', 'DISK', 'HBMX']) {
  const res = await fetch(`${BASE}/holdings/daily?symbol=${symbol}&pageSize=1000`, {headers});
  if (!res.ok) {
    throw new Error(`${symbol}: HTTP ${res.status}`);
  }
  const body = await res.json();
  const mix = {};
  for (const row of body.data) {
    const kind = instrumentOf(row);
    mix[kind] = (mix[kind] ?? 0) + row.pctVal;
  }
  const rounded = Object.fromEntries(Object.entries(mix).map(([kind, pct]) => [kind, +pct.toFixed(2)]));
  console.log(symbol, body.reportDate, JSON.stringify(rounded));
}
Applied to the files we captured on November 14, 2026, the same logic gives:
DRAM 2026-11-16 {"shares":54.01,"moneyMarket":17.51,"treasury":41.74,"swap":45.96,"cash":-59.25}
KMEM 2026-11-12 {"treasury":86.31,"shares":29.05,"moneyMarket":5.52,"option":-19.56,"cash":-1.33}
DISK 2026-11-13 {"shares":92.7,"swap":6.42,"cash":0.9}
HBMX 2026-11-13 {"shares":94.67,"swap":4.23,"moneyMarket":2.64,"cash":-1.52}
Three things to know when you read that output:
- Swap rows are reported at notional, and the fund's
Cash & Otherline carries the offset. That is why DRAM shows a large negative cash figure next to its Treasury bills. - Option rows are reported at market value, so KMEM's pairs net to a negative weight. For exposure, multiply the contracts by 100 and by the underlying's close from /api/price/history.
- The classifier reads issuer naming. It fits the four files here; check the rows the first time you run it on a fund from another issuer.
Daily holdings are on the ETF and Pro plans, and /api/fund/holdings/daily/supported-funds (free) confirms a fund is covered before you pay for anything. The filed quarterly book is at /api/fund/holdings, expense ratios at /api/fund/fees and filed net assets at /api/fund/profile. How the daily file and the quarterly filing relate is covered in how often ETF holdings update, and measuring how much two funds share is in the ETF overlap API guide.
To read a fund without writing code, the DRAM holdings page on the research portal shows the same data in the browser. To run the script, a covers fund profiles, prices and the supported-funds list.
FAQ
Q.What is the best memory ETF for 2027?
Q.What does the DRAM ETF hold?
Q.Why does the DRAM ETF use total return swaps?
Q.Does the DRAM ETF own Micron stock?
Q.What is the difference between DRAM, KMEM, DISK and HBMX?
Q.Which memory ETF holds mostly physical shares?
Q.Are there leveraged memory ETFs?
Q.How can I check whether an ETF uses swaps?
/api/fund/holdings/daily, a swap is its own row, named with SWAP or TRS, and an option row carries an option symbol. Sum the weights by instrument and compare them with the share rows. A large Treasury bill or money market position next to a small stock book is the other sign.Ready to build?
Free API key, no credit card.