AI Financial Analysis With an SEC Audit Trail
AI financial analysis of Netflix's 10-K: an agent traces cash flow, buybacks and a split-adjusted EPS figure, each checked against SEC filing pages.
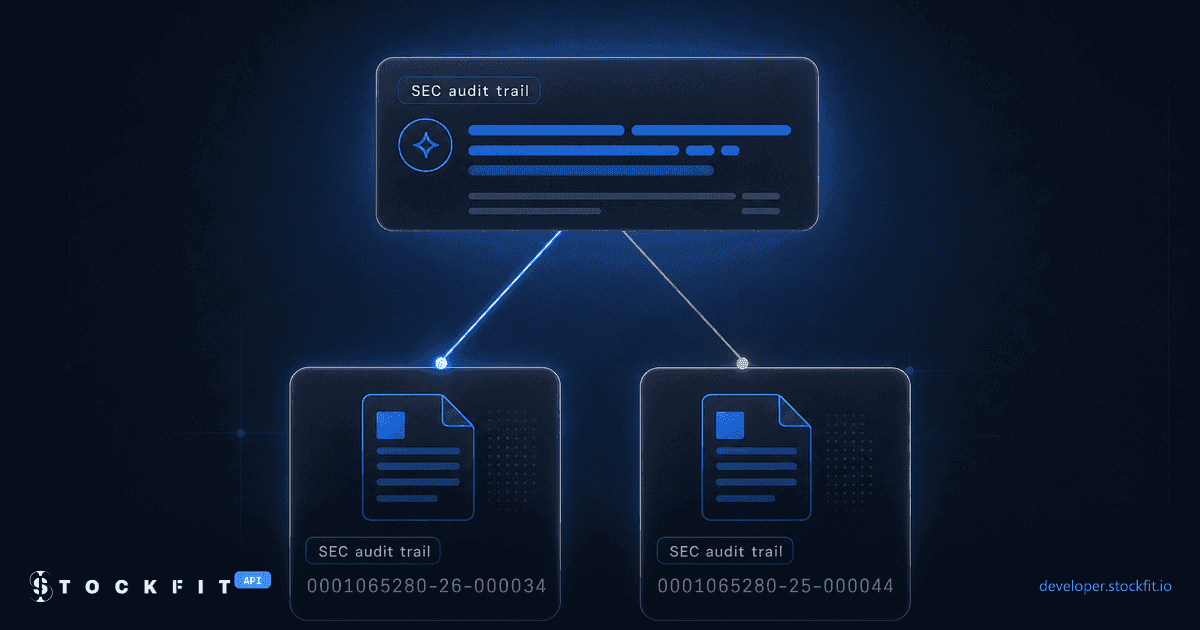
An agent connected to the StockFit MCP server can answer a multi-statement question about one company and return every reported figure with the accession number of the 10-K it came from, with the values the server computed itself labelled as such. The question in this post is about Netflix's year ended 2025-12-31: how profit and cash flow developed, how much of free cash flow went to buybacks, and why two 2024 earnings-per-share figures differ ten-fold. It takes four tool calls, and the last of them turns an accession number into the filing URL.
Every figure below was pulled from the live API with the MCP tools on November 12, 2026; each reported value was then checked against the filing page printed next to it, and the computed lines are arithmetic on those values. This is one worked example, not a product tour: the same method works for any filer, and it is data, not investment advice.
A financial number without a filing behind it is a guess
Netflix filed its 10-K for the year ended 2025-12-31 on 2026-01-23. No model trained before that date can know what is in it, and a model asked to estimate it produces a plausible number with no period behind it. Two fields separate an answer a reader can check from one they cannot: the period end date, and the SEC accession number of the filing the value was read from. Both come back attached to the value, not buried in a footnote.
The rest of this post takes one answer apart field by field. The stock research agent post builds the agent and the verifier that re-checks its claims before a brief ships; this one shows what the response contains, what a reader can audit, and where the trail stops.
One question, four tool calls, every reported figure checked against the filing
The question: how did Netflix's 2025 profit and cash flow develop, how much of its free cash flow went to buybacks, and why do two EPS figures for 2024 differ ten-fold?
Four calls answer it. financials_income_statement returns the income statement and the EPS series, financials_cash_flow_statement returns cash generation and buybacks, company_stock_splits returns the split record, and filings_search_by_accession_number turns the accession number into the filing URL. Here is the first call and the top of what it returns:
// financials_income_statement { symbol: "NFLX", period: "annual", limit: 2 }
{
  "period": "2025-12-31",
  "fiscalYear": 2025,
  "fiscalPeriod": "FY",
  "dateFiled": "2026-01-23",
  "acceptedAt": "2026-01-23T21:06:33Z",
  "facts": {
    "revenue": 45183036000,
    "operatingIncome": 13326603000,
    "netIncome": 10981201000,
    "eps": 2.58,
    "epsDiluted": 2.53,
    "weightedAverageSharesOutstanding": 4249512000
  },
  "sources": {
    "0001065280-26-000034": { "type": "10-K", "dateFiled": "2026-01-23", "amendment": false }
  },
  "derived": ["grossProfit", "sellingGeneralAndAdministrativeExpenses", "operatingExpenses", "costAndExpenses", "ebit", "ebitda"]
}
// 1 more period in the same response: FY ended 2024-12-31, accession 0001065280-25-000044
Nine of the ten line items below come straight out of those responses. The tenth, free cash flow, is arithmetic on two of them, and the response says so by listing it under derived.
| Figure | FY ended 2025-12-31 | FY ended 2024-12-31 | Tool | Check on the filing page |
|---|---|---|---|---|
| Revenue | $45.183B | $39.001B | financials_income_statement | R3: 45,183,036 / 39,000,966 |
| Operating income | $13.327B | $10.418B | financials_income_statement | R3: 13,326,603 / 10,417,614 |
| Net income | $10.981B | $8.712B | financials_income_statement | R3: 10,981,201 / 8,711,631 |
| Basic EPS | $2.58 | $2.03 | financials_income_statement | R3: 2.58 / 2.03 |
| Diluted EPS | $2.53 | $1.98 | financials_income_statement | R3: 2.53 / 1.98 |
| Weighted-average shares (basic) | 4,249.5M | 4,295.2M | financials_income_statement | R3: 4,249,512 / 4,295,191 |
| Operating cash flow | $10.149B | $7.361B | financials_cash_flow_statement | R5: 10,149,273 / 7,361,364 |
| Capital expenditure | $688.2M | $439.5M | financials_cash_flow_statement | R5: (688,220) / (439,538) |
| Repurchases of common stock | $9.127B | $6.264B | financials_cash_flow_statement | R5: (9,127,167) / (6,263,746) |
| Free cash flow (computed) | $9.461B | $6.922B | financials_cash_flow_statement | 10,149,273 - 688,220 = 9,461,053 |
Both statement calls use symbol=NFLX, period=annual, limit=2. The SEC column prints each value the way the filing does, next to the page it was read from: in thousands for the six dollar rows, where the API returns dollars; in dollars per share for the two EPS rows; and in thousands for the weighted-average share count, where the API returns a share count. The tenth row, free cash flow, is not a line on either statement page: its check is the subtraction of two R5 rows, 10,149,273,000 minus 688,220,000 equals 9,461,053,000, the same number the endpoint serves under derived.
The two filings behind the table are the 10-K for the year ended 2025-12-31, 0001065280-26-000034, filed 2026-01-23, and the prior year's 10-K, 0001065280-25-000044, filed 2025-01-27. The second statement call supplies the cash flow and buyback rows:
// financials_cash_flow_statement { symbol: "NFLX", period: "annual", limit: 2 }
{
  "period": "2025-12-31",
  "fiscalYear": 2025,
  "dateFiled": "2026-01-23",
  "facts": {
    "operatingCashFlow": 10149273000,
    "capitalExpenditure": 688220000,
    "commonStockRepurchased": 9127167000,
    "freeCashFlow": 9461053000
  },
  "derived": ["netCommonStockIssuance", "netIssuancePaymentsOfDebt", "beginningCash", "changeInWorkingCapital", "changeInCash", "freeCashFlow"]
}
Each filing is then one call away from its accession number: the fourth call, filings_search_by_accession_number, takes 0001065280-26-000034 and returns the form type, the period end date, the EDGAR URL and whether the filing carries XBRL.
Free cash flow rose 36.7%, and buybacks took 96.5% of it
These figures are computed by hand from the rows above, so treat them as arithmetic on the filing rather than as reported numbers. Revenue grew 15.9% to $45.183B from $39.001B, operating income grew 27.9%, and the operating margin widened to 29.5% from 26.7%. Operating cash flow grew 37.9% to $10.149B. Capital expenditure grew 56.6% to $688.2M, still only 1.5% of revenue.
Free cash flow, operating cash flow minus capital expenditure, rose 36.7% to $9.461B from $6.922B. Buybacks grew faster, 45.7% to $9.127B, which is 96.5% of free cash flow against 90.5% a year earlier. That leaves $333.9M of free cash flow unspent on repurchases, and basic weighted-average shares -1.1%.
One more pair is worth flagging without explaining it: net income of $10.981B sits just above operating cash flow of $10.149B. The endpoint reports both and stops there. The reconciliation in the filing is where the difference between them is accounted for, and it is worth reading before you build a cash-conversion ratio on the two lines. For what the repurchase fields mean, including the difference between shares retired and shares moved into treasury, the stock buyback API post covers the field shapes.
Two 2024 EPS figures, ten-fold apart: the 10-for-1 split
The EPS row above reads 2.58 for 2025 and 2.03 for 2024, a gain of 27.1% on the current share basis. The same endpoint, in the same response, carries a different 2024 value in the sources block:
// the FY ended 2024-12-31 row of the same income statement response
{
  "period": "2024-12-31",
  "facts": { "eps": 2.03, "epsDiluted": 1.98, "weightedAverageSharesOutstanding": 4295191000 },
  "sources": {
    "0001065280-25-000044": { "type": "10-K", "dateFiled": "2025-01-27", "amendment": false },
    "0001065280-26-000034": {
      "type": "10-K",
      "dateFiled": "2026-01-23",
      "facts": {
        "eps": { "concept": "us-gaap:EarningsPerShareBasic", "unit": "USD/shares", "before": 20.28 },
        "epsDiluted": { "concept": "us-gaap:EarningsPerShareDiluted", "unit": "USD/shares", "before": 19.83 },
        "weightedAverageSharesOutstanding": {
          "concept": "us-gaap:WeightedAverageNumberOfSharesOutstandingBasic",
          "unit": "shares",
          "before": 429519000
        }
      }
    }
  }
}
Both figures are right, on different bases. The 2024 10-K, 0001065280-25-000044, reported basic EPS of 20.28 and diluted EPS of 19.83 on 429,519,000 thousand basic shares. The 2025 10-K, 0001065280-26-000034, restated that comparative on the post-split basis: 2.03 basic and 1.98 diluted on 4,295,191 thousand shares. The split record explains the factor: a 10-for-1 forward split dated 2025-11-14, disclosed in the 10-K filed 2026-01-23, and the endpoint serves the adjusted values by default, with the earlier value kept under before.
A series that mixes the two bases shows EPS falling 87.3%, from 20.28 to 2.58, in a year net income rose 26.1%. The two figures are 9.99 times apart, which is the 10-for-1 split showing through the rounding of per-share values, not a collapse. The tool's response keeps both values, so the reader can see the seam instead of guessing at it; the method for handling seams like this across a whole history is in the split-adjusted EPS guide.
Every reported value carries the accession number of the filing it came from
The audit trail is the sources map on every statement row. Its key is the accession number, and its value carries the form type, the filing date, the acceptance timestamp and an amendment flag. With includeSourceDetails=true each fact also names the XBRL concept and the unit it was read in, which is what lets you find the line in the filing's own taxonomy rather than in a renamed field.
- The accession key resolves to a filing. /api/filings/search-by-accession-number returns the form type, the period end date, the filing URL on EDGAR and whether the filing carries XBRL, which is how
0001065280-26-000034became2025-12-31in this post. - The filing date and acceptance timestamp are what a point-in-time study needs.
2026-01-23T21:06:33Zis when EDGAR accepted the 2025 10-K, not the day the fiscal year ended. - The
derivedarray names the fields StockFit computed. Free cash flow, gross profit, EBITDA and operating expenses appear there; revenue, net income and the cash flow lines do not. - A restated comparative keeps its prior value under
before, as the 2024 EPS row shows. That is a visible seam, not a silent rewrite.
Both statements, the accession lookup and the raw /api/financials/as-reported view are on every plan including Free, with longer history on the paid plans. The split record comes from /api/company/stock-splits, which needs the Stock or Professional plan, and the statements themselves are /api/financials/income-statement and /api/financials/cash-flow-statement.
Check any of it in three steps
Nothing above has to be taken on trust, and the check takes about a minute per figure:
- Take the accession number from the row. Each of the nine reported values in the table above carries
0001065280-26-000034or0001065280-25-000044in itssourcesblock; the computed free cash flow row is the subtraction of two of them. - Resolve it to a document. The accession lookup returns the filing URL, and the EDGAR filing index lists every page the filing was rendered into.
- Open the statement page and search the value. For the reported figures that is R3 for the income statement and R5 for the cash flows; the 2024 figures as filed are on R3 of the prior 10-K. Free cash flow is not printed on either page, which is why its row shows the subtraction instead of a page and a line.
That is the whole audit. A number with no accession number behind it cannot be checked this way, which is the practical reason to prefer a data source that carries one per value.
Keep the agent focused on the filings
The StockFit MCP server listed 125 data tools for a Professional key when we pulled its list_available_tools_of_current_plan on November 12, 2026, which is far more than any one question needs. Anthropic's tool search documentation is blunt about the consequence: Claude's ability to pick the right tool degrades once you exceed 30 to 50 available tools, and tool search exists to load only the few a request needs. VS Code caps a chat request at 128 tools enabled at a time, so two full servers will not fit in one. The fix on the consumer side is an allowlist, and the stock research agent post wires one: five tools (company details, income statement, cash flow statement, insider transactions and the accession lookup) for the statements and the audit trail. This post's example adds a sixth, company_stock_splits, for the split record that explains the two EPS bases, and four of the six answer the question above while the rest of the server stays out of the context.
MCP or REST for financial data
Use REST when the calls are fixed. A pipeline that pulls the income statement and the cash flow statement for a list of tickers is four deterministic HTTP requests with no model in the loop, which is cheaper, cacheable and easier to test:
curl "https://api.stockfit.io/v1/api/financials/income-statement?symbol=NFLX&period=annual&limit=2&includeSourceDetails=true" \
  -H "Authorization: Bearer $STOCKFIT_API_KEY"
Use MCP when the question is open and an agent has to choose the tools itself. It is the same endpoints behind the same API key either way, so the accession numbers, the filing dates and the before values come out identical. Setup for Claude, Cursor and VS Code is on the MCP page, and the ChatGPT app post covers the client side.
Where the audit trail stops
- Derived is not reported. Free cash flow, gross profit, EBITDA and operating expenses are computed by StockFit. Quote them as computed, and quote the filing's own lines when you need a filed number.
- Normalised fields can differ from the filer's captions. The
concepton each fact, available withincludeSourceDetails, is the bridge back to the taxonomy tag the filer used. - The latest filing wins. These endpoints serve the most recently filed value for a period, so a later 10-K can replace an earlier one, as the 2024 EPS row shows, with the replaced value kept under
before. A backtest that ignores filing dates will read restated history as if it were original. - The period key is the API's own. It reads 2025-12-31 here, which is this filing's period end date, and the accession lookup returns the same date. When a study depends on the exact day, confirm it from the accession rather than assuming the two always agree.
- It reports; it does not explain. Net income sitting above operating cash flow is reported as two values. The reason is in the filing.
- It is not advice. Nothing here is a view on Netflix or on any security.
A free key returns the latest fiscal year of both statements and the accession lookup, so the three-step check above runs on the Free plan. Longer history and the split record need a paid plan. to pull a filing-backed answer for any ticker.
FAQ
Q.Can an AI agent do financial analysis with SEC filings?
0001065280-26-000034; the tenth line, free cash flow, is computed from two of those rows and labelled computed. The limit is sourcing, not arithmetic: no model can know a 10-K filed after its training data, so the answer has to come from an API that carries the period end date and the accession number per value.Q.How do I verify a number an AI agent gives me from a 10-K?
Q.What is a financial data MCP server?
Q.How do I limit which tools Claude can use from an MCP server?
mcp_toolset for the server and lets you configure tools individually, so a client can carry five of a server's tools rather than all of them. The stock research agent post wires exactly that allowlist: company details, income statement, cash flow statement, insider transactions and the accession lookup. Anthropic's tool search documentation says Claude's ability to pick the right tool degrades once you exceed 30 to 50 available tools.Q.Does the StockFit MCP server show every tool on the Free plan?
list_available_tools_of_current_plan reports what the key in use can actually call. Use that tool to build the allowlist; the tier-scoped API reference pages list the same sets by plan, and setup for every client is on the MCP page.Q.What is the difference between reported and derived fields in StockFit data?
includeSourceDetails=true. Derived fields are computed by StockFit and named in a derived array on the response: in the Netflix example that is gross profit, operating expenses, EBITDA and free cash flow. Free cash flow, operating cash flow minus capital expenditure, is not a line in a Netflix filing, so label it as computed whenever you quote it.Q.Why do two Netflix EPS figures for 2024 differ ten-fold?
0001065280-25-000044, reported basic EPS of 20.28 and diluted 19.83 for 2024, on 429,519,000 thousand basic shares. The fiscal 2025 10-K, accession 0001065280-26-000034, restates the 2024 comparative on the post-split basis: 2.03 basic and 1.98 diluted on 4,295,191 thousand shares, after the 10-for-1 forward split dated 2025-11-14 in the split record. The ratio between them is 9.99, so a series that mixes the two bases shows an 87.3% EPS fall in a year net income rose 26.1%.Q.Should I use an MCP server or a REST API for financial data?
Ready to build?
Free API key, no credit card.