Free Stock Research Portal: SEC Data, No Login
Free stock research: SEC financials, earnings call transcripts, fund holdings, no login. Most main panels name the API endpoint behind them.
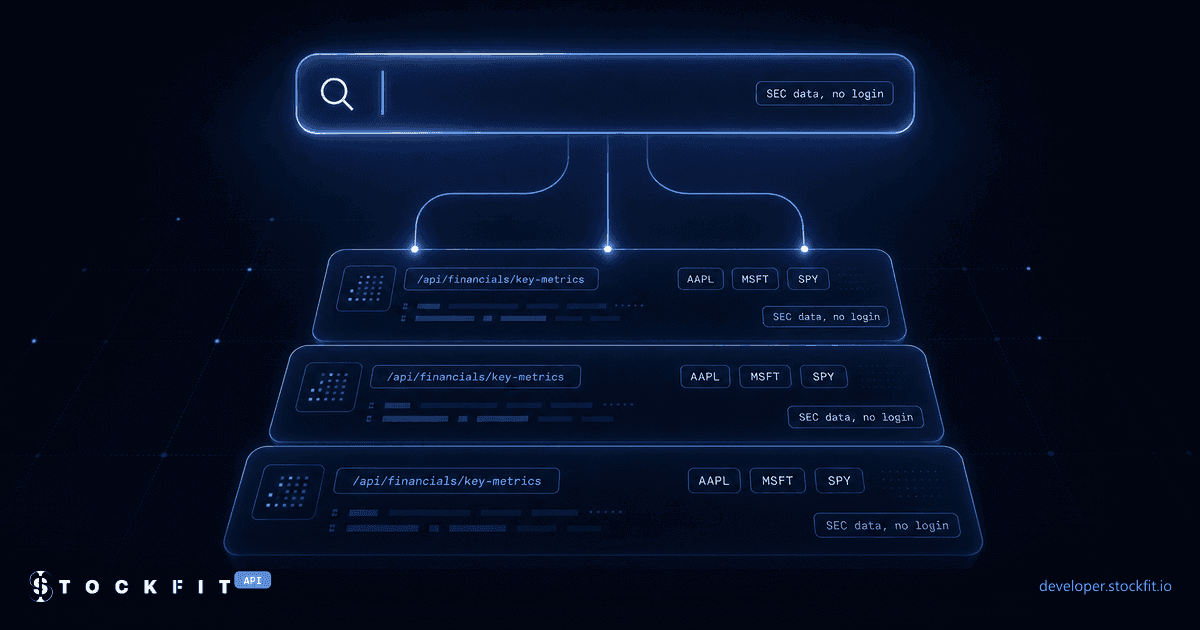
StockFit's research portal is live at developer.stockfit.io. The homepage is a ticker search: type a symbol or a company name, or press / to jump into the box, and open a result. Every US stock and fund in coverage gets a page of its own, built on the same SEC data the API serves.
Browsing needs no account. The preview an anonymous visitor sees is real filing data, not a mockup, and the main panel of each stock tab prints the API request behind it, with a copy button (the Calls tab is the exception; on a fund page, Holdings, Daily holdings, Ownership and Filings print it too). That makes the portal a live demo of the API: find a number you want, copy the request, and call it yourself from code.
This post walks through what launched: the search landing and the two page layouts, a stock page for Apple, a fund page for SPY, what the anonymous preview includes, what each plan adds, and the panel to endpoint map that ties the browser and the API together. Every figure below was pulled from the live tools and the live portal on November 14, 2026; where a number comes from a filing, the document behind it is named.
What launched: a ticker search and a page per company, no login
The homepage is a search landing. One box searches stocks, ETFs and mutual funds, with an All, Stocks, ETFs & Funds filter and quick chips for Apple, Microsoft, NVIDIA and SPY. Below it, the same coverage the API serves is stated up front: 16.3K+ companies including delisted ones, 9.1M+ SEC filings, 422M+ data points.
A result opens a company page at /details/<symbol>. The layout depends on what the symbol is. A stock gets 9 tabs, a fund gets up to 5:
| Stocks (9 tabs) | Funds (up to 5 tabs) |
|---|---|
| Summary, Financials, Ratios, Earnings, Calls, Ownership, Filings, Segments and Insiders | Summary, Holdings, Daily holdings, Ownership and Filings |
Each tab is its own URL, so a link lands on the section it names: /details/AAPL/financials, /details/AAPL/ownership, /details/SPY/holdings. Funds have no financials, earnings, calls, segments or insiders tabs, because a fund reports holdings instead of statements; asking a fund for one of those URLs redirects to its summary. The Daily holdings tab is shown only where the issuer publishes a daily file, so a mutual fund page usually has 4 tabs.
The anonymous preview is a fixed slice of each page, and it is documented by the numbers: 4 quarters of financials, 1 annual year with 5 locked placeholder columns beside it, 5 filings (7 on the Filings tab, 3 more rows locked), 6 news headlines, 5 institutional holders, 5 insider trades, 5 fund holdings, and the first 50% of each call's prepared remarks. No account, no email, no key.
Coverage at launch, from the live coverage page: 6,840 operating companies plus 9,528 delisted ones, 16,368 in total across 45 countries, and 11 sectors split into 377 industries. On the fund side: 5,612 ETFs, 5,725 mutual funds and 376 closed-end funds, with 122M+ position rows from N-PORT reports and 5,525 of the 5,612 ETFs also covered by daily issuer files. The coverage page recomputes these once a day from the same database the API serves; these are the figures it showed on November 14, 2026, with data through November 12, 2026.
A stock page walkthrough: Apple
Open /details/AAPL and the header answers four questions before you scroll: revenue, net income, basic EPS and the next earnings date. For Apple's fiscal 2026 that reads revenue $478.8B, net income $132.2B, basic EPS 9.01, and next earnings January 28, 2027.
The Summary tab is the page in miniature. It carries a revenue and net income chart for the last four quarters, a key figures panel, the latest filings, the company profile and recent news. The key figures panel is the one to look at first, because its header prints the request behind it:
| Key figure, FY2026 | Value | Where it comes from |
|---|---|---|
| Revenue | $478.8B | 10-K for the year ended 2026-09-26 |
| Gross margin | 48.79% | Derived from revenue and cost of revenue |
| Operating margin | 33.01% | Derived from operating income and revenue |
| Net income | $132.2B | 10-K for the year ended 2026-09-26 |
| Basic EPS | 9.01 | 10-K for the year ended 2026-09-26 |
| Free cash flow | $136.1B | Derived: operating cash flow minus capital expenditure |
| ROIC | 81.89% | Derived from after-tax operating income and invested capital |
| Net debt / EBITDA | 0.34x | Derived from the balance sheet and income statement |
The panel does not ask you to take any of it on faith. Every value in the panel traces to a filing: Apple's fiscal 2026 figures come from the 10-K for the year ended 2026-09-26, filed November 3, 2026 as accession 0000320193-26-000026. Revenue in that filing is tagged us-gaap:RevenueFromContractWithCustomerExcludingAssessedTax, and the API returns that concept and accession alongside the number, so you can open the document on SEC EDGAR and find the row yourself.
The Ratios tab goes deeper on the same filing: gross margin 48.79%, operating margin 33.01%, net margin 27.60%, return on equity 142.26%, return on invested capital 81.89% and free cash flow at 102.94% of net income. The two composite health scores are served by a separate endpoint, /api/financials/scores: for Apple that reads a Piotroski F-Score of 9 out of 9 and an Altman Z-Score of 2.76, in the grey zone. What those two scores measure, and how to read the gap between them, is covered in the financial health score API.
Three more panels on the same page, each fed by a different endpoint:
- Latest filings: the recent forms newest first, each with the form type, a plain label and the date, including the 10-K filed November 3, 2026. The same filing is the receipt for the figures above.
- Company profile: CIK, sector, industry, address, IPO date, fiscal year end and website, plus peers in the same industry ranked by revenue.
- News: 6 recent headlines with the source and timestamp, footnoted as coming from public news sources and not from the SEC data.
The Ownership tab rolls up the other side of the company: 6,163 institutional holders holding 66.39% of shares outstanding at 2026-06-30, led by BlackRock, Inc. at 7.96% and Vanguard Capital Management LLC at 6.57%, with the largest quarter-over-quarter increases and decreases listed beside them.
The Financials tab: XBRL tags, restatements and reconstructed quarters
The Financials tab is the one a data reader will live in. It switches between the income statement, the balance sheet and the cash flow statement, in annual or quarterly view, with trailing twelve months computed from the last four quarters. Values are as last filed, and the tab is explicit about it: Values as last filed in AAPL's 10-K and 10-Q filings. Hover or tap a value for its XBRL tag and filing. TTM adds up the last four quarters.
Turn on Show XBRL tags and each cell reveals the tag behind it and the filing that supplied it. That is the feature that makes the tab different from a screener: Apple's fiscal 2026 revenue row shows us-gaap:RevenueFromContractWithCustomerExcludingAssessedTax from accession 0000320193-26-000026, so the value and its source are on screen together.
Two more conventions are worth knowing before you read a table. Restated values are highlighted, because the API serves the most recently filed value and the tab tells you when a later filing changed an earlier one. And quarters the filer never tagged as a quarter are underlined: Apple's Q4 is the full year minus the first nine months, so the portal derives it and marks it as reconstructed. Its Q3, by contrast, was filed as a quarter: the period ended 2026-06-27, revenue $109.4B, filed July 31, 2026 in accession 0000320193-26-000020. The derived Q4 is the full year minus the first nine months, revenue $114.5B, and the page says so in a footnote rather than passing it off as a filed quarter.
The unit switch offers Auto, K, M and B, and the default follows the filer's own size: millions for most filers, thousands when the largest amount would otherwise read as a handful of millions. The three statements map one to one onto the API: /api/financials/income-statement, /api/financials/balance-sheet and /api/financials/cash-flow-statement. If you only need ratios, the Ratios tab and a company's Summary key figures panel both draw on /api/financials/key-metrics.
Earnings call transcripts in the browser, still in beta
The Calls tab is the newest and the most clearly labelled: it carries a Beta badge on the tab itself. Open a call and you get an audio player, a word-level transcript in the Transcript view, a presentation view with rolling captions, and a tone score for the prepared remarks that is ranked against other calls and tracked across the company's own calls. The transcript highlights the words as the audio plays, so you can jump to a sentence by clicking it, and a speaker is named only when the model is confident, at 0.8 or above; below that the label stays Speaker N rather than guessing.
The anonymous preview cuts at the last sentence that ends at or before the halfway point of the prepared remarks, so an anonymous reader sees the first 50% of a call's prepared remarks. The rest of the call, including the Q&A, is a Pro feature, and the tab says so in place rather than hiding the cut. The Calls tab also prints no public API endpoint: the transcript is served by the portal's own route while the feature is in beta. The dates around a call come from the earnings endpoints, which the earnings calendar API covers.
The endpoint behind each main panel, and the two that print none
This is the design decision the rest of the portal hangs on. Every stock tab's main panel prints the request behind it in its header, with the parameters that differ from the endpoint's defaults, and a copy button that puts the full URL on your clipboard. Two panels are the exception: the Calls tab, as noted above, and a fund's Summary tab, which has no single request to print. On a fund page, Holdings, Daily holdings, Ownership and Filings all carry the chip. The Apple summary page prints:
GET /api/financials/key-metrics?symbol=AAPL
Copy it, add your key, and you get the panel's numbers as JSON. The mapping across the page:
| Panel | Endpoint printed in the header |
|---|---|
| Summary (company), Ratios | /api/financials/key-metrics |
| Financials | /api/financials/income-statement |
| Earnings | /api/earnings/eps-history |
| Ownership (company) | /api/ownership/summary |
| Ownership (fund) | /api/ownership/institutional-holders |
| Filings | /api/filings |
| Segments | /api/footnotes/business-segmentation |
| Insiders | /api/insider-transactions |
| Holdings | /api/fund/holdings |
| Daily holdings | /api/fund/holdings/daily |
The map is not a marketing device, it is the honest version of the product. The portal does not hold a second copy of the data: it renders the same endpoints a subscriber calls, so what you see in the browser is what the API returns. Browsing a page teaches you the API surface without reading the docs first, and the docs are one click away when you want the parameter list. The six panels that carry most of a research session:
- /api/financials/key-metrics for the key figures panel on a company's Summary tab and for the Ratios tab, sector-aware and computed from the latest annual filing.
- /api/earnings/eps-history for the Earnings tab, EPS over time with basic and diluted figures.
- /api/filings for the Filings tab, the form list with dates and document links.
- /api/ownership/summary for the Ownership tab on a company, and /api/ownership/institutional-holders on a fund.
- /api/footnotes/business-segmentation for the Segments tab, per-segment revenue and profit from the footnote.
- /api/insider-transactions for the Insiders tab, officer and director trades with the filing behind each one.
Three practical notes. A panel shows only the parameters that differ from the defaults, so the Financials chip reads ?symbol=AAPL in the annual view and ?symbol=AAPL&period=quarter once you switch to quarterly. The chip is a copy button, not a live request: nothing is fetched until you call the URL yourself. And it renders only on screens 640px and wider, so on a phone a tab shows its data without the request line. If you would rather hand the whole surface to an agent, the same data is exposed over MCP, which is what the stock research agent walks through.
Fund pages: holdings, daily holdings and the fund layout
A fund gets the shorter layout, up to 5 tabs, and the swap is deliberate: a fund has no income statement to show, but it has a portfolio, which a company does not. Open /details/SPY and the Holdings tab reports 504 positions against $781.19B of net assets at 2026-06-30, from the fund's N-PORT report. The top of the book:
| Holding | Ticker | CUSIP | Weight |
|---|---|---|---|
| NVIDIA Corp | NVDA | 67066G104 | 7.52% |
| Apple Inc | AAPL | 037833100 | 6.59% |
| Microsoft Corp | MSFT | 594918104 | 4.30% |
| Amazon.com Inc | AMZN | 023135106 | 3.62% |
| Alphabet Inc | GOOGL | 02079K305 | 3.25% |
| Broadcom Inc | AVGO | 11135F101 | 2.77% |
Every row carries the identifiers a join needs where the filing reports them: CUSIP, ISIN, the mapped ticker and CIK, the share count, the dollar value, the weight and the fair value level. The anonymous preview shows 5 holdings and locks the rest, which is enough to check the shape of the data before you subscribe.
The Daily holdings tab is the faster source and a premium one. Where N-PORT is quarterly and published about two months after the quarter ends, the daily file is what the issuer publishes on its own website, captured every trading day, and it covers 5,525 of the 5,612 ETFs, about 98%. The portal keeps roughly 45 days per fund, so you can see what changed and when. Both tabs are built on the same endpoints: /api/fund/holdings for the quarterly report and /api/fund/holdings/daily for the daily file. The trade-offs between the two sources are the subject of the ETF holdings API comparison, and the mutual fund side, where N-PORT is usually the only complete source, is in the mutual fund holdings API.
One account, two surfaces: the research portal or the API
The portal and the API are the same product seen from two sides. The dashboard puts them next to each other: a search box under Research in your browser and your API key under Use the API, both labeled as one account over the same data. A single plan sets the history both surfaces show, so there is no separate research subscription to buy.
| Plan | What the pages show |
|---|---|
| Free | the public preview, 4 quarters and 1 annual year |
| Starter | 10 years and 40 quarters of history |
| Pro | full history and whole earnings calls |
The free plan is the anonymous preview, and it needs no account at all. Starter widens the history to 10 years and 40 quarters. Pro adds whole earnings calls, including the question and answer section that the preview cuts. Prices are on the pricing page.
If you want the data in code, and the same pages keep working; the key only raises the limits. If you would rather just read a company, the search box is already there, with no key, no login and no credit card.
FAQ
Q.Is the StockFit research portal free to use?
Q.Do I need an account to browse company pages?
/details/<symbol> render for anonymous visitors with no login and no API key, and the preview limits are applied server-side, so data past them is never fetched. An account adds history depth on the same pages and unlocks the API with the same plan.Q.What is the difference between the research portal and the StockFit API?
Q.Which SEC data does a company page include?
0000320193-26-000026.Q.Can I research ETFs and mutual funds on the portal?
Q.Does the portal show XBRL tags and restated values?
us-gaap:RevenueFromContractWithCustomerExcludingAssessedTax from 0000320193-26-000026. Values a later filing changed are highlighted as restated, and quarters the filer did not tag, such as Apple's Q4, are underlined as reconstructed from year-to-date totals.Ready to build?
Free API key, no credit card.