Financial Modeling Prep Alternatives for 2026
Financial Modeling Prep alternatives compared on price, free tier, commercial license, and SEC audit trail, from StockFit and EODHD to SEC EDGAR APIs.
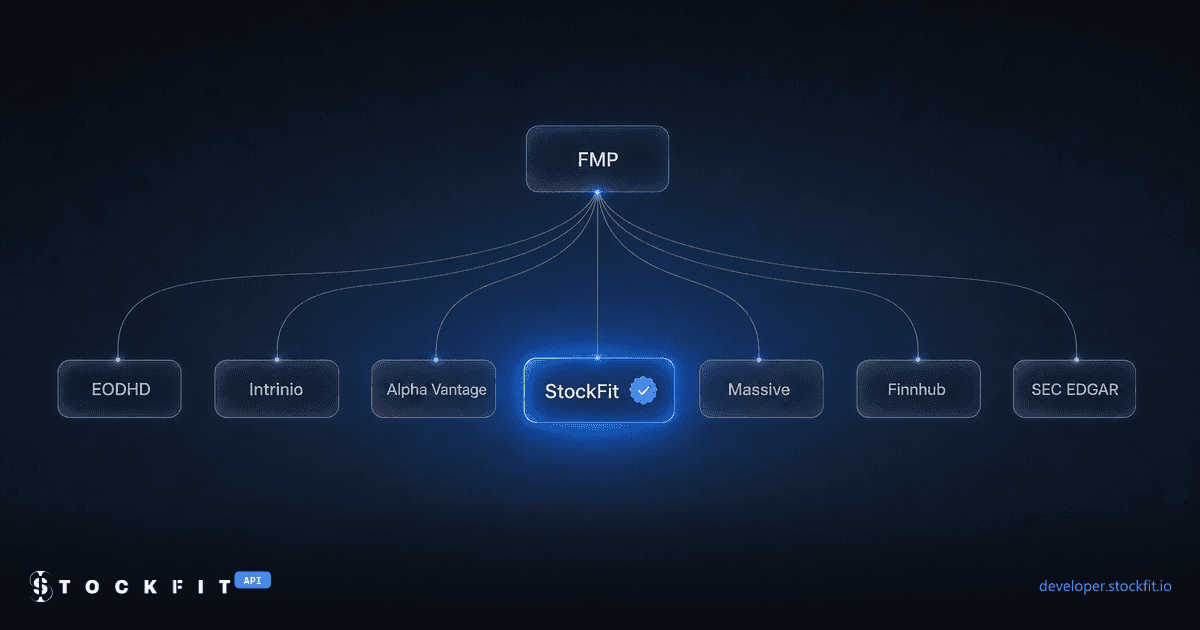
Financial Modeling Prep is often the first fundamentals API a developer wires up: a free key, more than 150 endpoints, and paid plans from $19 a month billed annually. The reasons teams start looking for Financial Modeling Prep alternatives usually show up later, when the side project becomes a product: the license, the plan tier a specific dataset sits behind, and the first time a customer asks where a number came from.
We build StockFit, one of the seven FMP alternatives below, and we rank it first for SEC-traceable US fundamentals. Every price, limit, and field name in this post was checked against the vendor's own pricing page, documentation, or a live API response on October 16, 2026, and where another provider is the better fit, we say so. For the wider market, see our roundup of the best fundamentals APIs; for a head-to-head on sector metrics, see StockFit vs FMP on key metrics.
Why developers look for Financial Modeling Prep alternatives
To be fair to FMP first: its free Basic plan includes 250 calls a day and more than 150 endpoints, and the paid plans add real-time market data, up to 30 years of historical data from Premium, global coverage on Ultimate, earnings call transcripts, technical indicators, forex, and crypto, with rate limits from 300 to 3,000 calls a minute. For a personal research project, that is a lot of financial data API for the money. The friction points are specific, and each one comes from FMP's own pricing page and documentation.
1. The license is personal by default
FMP's four self-serve plans sit under a “Personal Use” tab. The “Commercial Use” tab is an Enterprise contact form, and the pricing page states: “Displaying or redistributing data sourced from FMP requires a specific Data Display and Licensing Agreement with FMP.” FMP's own plan guide says to contact sales when a workflow needs redistribution rights. If your app shows fundamentals to its users, the self-serve price is not the price you will pay.
2. Each dataset sits behind a different plan
On the free Basic plan, financial statements cover 87 symbols (“AAPL, TSLA, AMZN and 84 more”) at five records per call, and key metrics and ratios are annual-only. Starter ($29 a month, or $19 billed annually) lists “annual fundamentals and ratios” for US listings with up to five years of history. Premium ($69 a month, or $49 billed annually) lists “full fundamentals and ratios,” up to 30 years, and adds UK and Canada coverage. 13F institutional holdings, ETF and mutual fund holdings, earnings call transcripts, and bulk delivery are Ultimate-only, at $139 a month or $99 billed annually. Every plan also carries a trailing 30-day bandwidth cap, from 500 MB on Basic to 150 GB on Ultimate.
3. A row says when, not which filing
FMP's documented income statement response carries cik, filingDate, and acceptedDate on each row, but no SEC accession number. You can usually find the filing with a second lookup on EDGAR by CIK and acceptance time, but one date per row cannot say which filing supplied each value. That matters the first time a number looks wrong, and for any backtest that has to know what was public on a given day. We show what it looks like on a real Apple row below.
What to look for in an FMP alternative
- A license that matches your use. Personal research, internal tools, and a product that shows data to customers are three different licenses at most vendors. Price the one you actually need.
- Fundamentals depth per dollar. Quarterly statements, years of history, and symbol coverage on the plan you can afford, not on the plan in the headline.
- A source pointer on every value. At minimum a filing date; ideally the SEC accession number, form type, and filing date, so a value can be checked on EDGAR and replayed point-in-time without look-ahead bias.
- Data coverage that matches your universe. US-only is fine for many apps and a deal-breaker for others.
- The rest of the stack. Prices, corporate actions, insider trades, 13F, ETF holdings, estimates, and transcripts: decide which ones must come from the same vendor.
Financial Modeling Prep alternatives compared
FMP's own row comes first, so the differences are visible at a glance. Prices are monthly list prices; most vendors discount annual billing.
| Provider | Free tier | Fundamentals on free | Cheapest paid with fundamentals | Show data in your product | Source pointer on statements |
|---|---|---|---|---|---|
| Financial Modeling Prep | 250 calls/day | 87 symbols | $29/mo¹ | Separate agreement | Filing date per row |
| StockFit | 300 calls/day | All US-listed, 1 year | $19/mo² | From Starter | Accession per value |
| EODHD | 20 calls/day | Not included | $59.99/mo³ | Custom plan | Filing date per period |
| Intrinio | Free trial | Trial only | $150/mo⁴ | From $333/mo | Filing date, version type |
| Alpha Vantage | 25 calls/day | 25 calls/day | $49.99/mo | Written agreement | None |
| Massive (ex-Polygon) | 5 calls/min | Not included | $29/mo⁵ | Business plans | Latest filing date |
| Finnhub | 60 calls/min | As-reported only | $3,500/mo⁶ | Through sales | Accession per report |
| SEC EDGAR APIs | Free, 10 req/s | Raw XBRL | Free | Public data | Accession per fact |
Notes: ¹ FMP Starter covers annual fundamentals for US listings ($19 a month billed annually); FMP lists full fundamentals from Premium at $69 a month ($49 billed annually). ² StockFit Starter ($15 a month billed annually) adds the commercial license and five years of history; the free tier is personal use. ³ EODHD Fundamentals Data Feed, a personal plan; its $399 a month internal-use package does not allow showing data outside your company. ⁴ Intrinio Individual, personal use with no redistribution or display. ⁵ Massive Financials & Ratios add-on, individual use. ⁶ Finnhub All-In-One, billed annually; the free tier includes financials as reported but not standardized statements. All figures checked against each vendor's pricing page and documentation on October 16, 2026.
Same Apple numbers, different audit trail
Here is the difference on a real row. FMP's income statement documentation uses Apple's fiscal 2025 10-K as its example response. Trimmed to the identity fields and a few values, it reads:
// FMP: GET /stable/income-statement?symbol=AAPL (documentation example, excerpt)
{
  "date": "2025-09-27",
  "symbol": "AAPL",
  "cik": "0000320193",
  "filingDate": "2025-10-31",
  "acceptedDate": "2025-10-31 06:01:26",
  "fiscalYear": "2025",
  "period": "FY",
  "revenue": 416161000000,
  "generalAndAdministrativeExpenses": 27601000000,
  "sellingAndMarketingExpenses": 0,
  "netIncome": 112010000000,
  "epsDiluted": 7.46
}
StockFit's /api/financials/income-statement returns the same fiscal year like this, pulled live on October 16, 2026 (trimmed, values unaltered):
// StockFit: GET /v1/api/financials/income-statement?symbol=AAPL&period=annual&limit=2 (excerpt)
{
  "fiscalYear": 2025,
  "fiscalPeriod": "FY",
  "dateFiled": "2025-10-31",
  "facts": {
    "revenue": 416161000000,
    "sellingAndMarketingExpenses": 19524000000,
    "generalAndAdministrativeExpenses": 8077000000,
    "netIncome": 112010000000,
    "epsDiluted": 7.46,
    "ebit": 133050000000
  },
  "sources": {
    "0000320193-25-000079": {
      "type": "10-K",
      "dateFiled": "2025-10-31",
      "amendment": false,
      "facts": { "revenue": {}, "sellingAndMarketingExpenses": {}, "generalAndAdministrativeExpenses": {}, "netIncome": {}, "epsDiluted": {} }
    }
  },
  "derived": ["costAndExpenses", "amortization", "ebit", "ebitda"]
}
The headline numbers agree to the dollar: $416,161,000,000 of revenue, $112,010,000,000 of net income, and diluted EPS of $7.46, all of which tie to the XBRL in Apple's 10-K, accession 0000320193-25-000079, filed October 31, 2025. Three things differ.
Every value names its filing
The sources map ties each fact to the accession number, form type, filing date, and amendment flag of the filing that supplied it. Pass the accession to /api/filings/search-by-accession-number and you get the document itself:
// GET /v1/api/filings/search-by-accession-number?accessionNumber=0000320193-25-000079 (excerpt)
{
  "type": "10-K",
  "accessionNumber": "0000320193-25-000079",
  "url": "https://www.sec.gov/Archives/edgar/data/320193/000032019325000079/aapl-20250927.htm",
  "dateFiled": "2025-10-31",
  "xbrl": true,
  "amendment": false,
  "periodEndDate": "2025-09-27"
}
A filing date tells you when; an accession number tells you which document, so the value can be checked against Apple's 10-K on SEC EDGAR in one click.
Mapping choices become checkable
FMP's example books the full $27.601 billion of selling, general and administrative expense as generalAndAdministrativeExpenses and reports sellingAndMarketingExpenses as 0. Apple's 10-K XBRL tags the split: $19.524 billion of selling and marketing and $8.077 billion of general and administrative. Both rows sum to the same SG&A total, so a reconciliation check would never flag it, while a ratio like marketing spend over revenue reads 0% on one and 4.7% on the other. Normalization is a judgment call at every vendor, ours included: our ebit is operating income ($133.050 billion) where FMP's example reports $132.729 billion, which is why StockFit lists computed fields in derived instead of passing them off as filed facts. What a source pointer gives you is the ability to check.
Late facts keep their real filing date
The same call returns fiscal 2024 too, and that row cites two filings:
// Same call, fiscal 2024 row (excerpt)
{
  "fiscalYear": 2024,
  "fiscalPeriod": "FY",
  "dateFiled": "2024-11-01",
  "facts": { "revenue": 391035000000, "sellingAndMarketingExpenses": 18639000000, "generalAndAdministrativeExpenses": 7458000000 },
  "sources": {
    "0000320193-24-000123": { "type": "10-K", "dateFiled": "2024-11-01", "amendment": false, "facts": { "revenue": {}, "sellingGeneralAndAdministrativeExpenses": {}, "netIncome": {} } },
    "0000320193-25-000079": { "type": "10-K", "dateFiled": "2025-10-31", "amendment": false, "facts": { "generalAndAdministrativeExpenses": {}, "sellingAndMarketingExpenses": {} } }
  }
}
Most of fiscal 2024 comes from the 10-K filed November 1, 2024. The selling and marketing ($18.639 billion) and general and administrative ($7.458 billion) split was first tagged in the 10-K filed October 31, 2025, a year later, and the row says so. A backtest that treats the whole fiscal 2024 row as known on November 1, 2024 would use two numbers that were not public yet. That is the look-ahead trap covered in our guide to point-in-time data for backtesting, and the reason quant teams use our point-in-time fundamentals API.
“What sets StockFit apart is the audit trail. Every fact in the normalized statements carries its source filing and disclosure date, with derived fields called out separately and amendments handled properly. That's exactly what we want for explainable fundamentals deeper in our stack.”
Christopher Gordon, Founder & CEO, Quantum Trade Intelligence
1. StockFit, best for audit-grade US fundamentals you can ship
StockFit parses fundamentals directly from SEC EDGAR XBRL and returns both the normalized statements and the raw XBRL facts through /api/financials/as-reported, with the source map shown above on every row. The free tier is 300 requests a day (50 a minute) for personal use and already covers every US-listed company: income statement, balance sheet, cash flow, as-reported XBRL, EPS and dividend history, and the SEC filings index, with the latest year of history (one annual period and four quarters). The paid plans price by data depth rather than by request rate:
- Starter, $19 a month ($15 billed annually): the commercial license, 20,000 requests a day, five years of history, plus sector-aware /api/financials/key-metrics, Piotroski and Altman scores, growth rates, revenue and business segmentation, and quarterly N-PORT fund holdings.
- Stock, $59 a month ($39 billed annually): 20+ years of history and 100,000 requests a day, plus Form 3, 4, and 5 insider transactions, 13F holders and manager portfolios, 13D and 13G owners, executive pay versus performance, peers, IPO and earnings calendars, and the AI economic model with per-claim filing citations.
- ETF, $59 a month ($39 billed annually): daily ETF holdings, reverse lookup, overlap, flows, fees, and the fund exposure model.
- Pro, $99 a month ($69 billed annually): everything in Stock and ETF, plus the footnote suite (debt tranches, leases, pensions, buybacks, fair value hierarchy, and more), Congress trades, and 500,000 requests a day.
Quarterly rows carry the same source map. Q4, which no 10-Q reports, is reconstructed from the 10-K minus nine months, and the row says so in sources (Q4-Recon-FY-9M next to the 10-K accession), so a derived Q4 is never passed off as a filed one. We walk through that math in how to calculate Q4 earnings from SEC filings. For product builders, the financial data API for app developers page shows the rest of the surface, and the same data is available to Claude, Cursor, and VS Code through the StockFit MCP server.
Where it falls short of FMP, plainly: US-listed companies only (NYSE, NASDAQ, and NYSE Arca), price history in daily, weekly, and monthly bars rather than intraday or real-time streams, and no earnings call transcripts, analyst estimate history, forex, crypto, or technical indicators. The free tier is personal use, the same restriction FMP, Alpha Vantage, and Finnhub put on theirs.
2. EODHD, best for global fundamentals on a personal plan
EODHD is the closest like-for-like swap if global coverage is why you chose FMP. Its Fundamentals Data Feed plan, $59.99 a month on personal pricing (two months free on annual billing), covers stock and ETF fundamentals worldwide plus US insider transactions, with US history back to 1985 for major companies and back to 2000 for non-US names. The plan allows 100,000 API calls a day, but each fundamentals request costs 10 calls, so the practical ceiling is 10,000 fundamentals requests. The free plan is 20 calls a day with no fundamentals.
EODHD says its fundamentals are collected from financial news providers, company websites, and annual reports, with direct extraction from sec.gov for US filers, and its statement records carry a filing date rather than an accession number. The license is the catch for product builders: the $399 a month commercial internal-use package does not allow displaying data outside your company, and display rights need a custom plan.
3. Intrinio, best for SEC-sourced data with display rights
Intrinio is the SEC-sourced option with the clearest commercial path. Its US fundamentals feed covers standardized and as-reported financial statements back to 2006, sourced directly from the SEC, with metrics, institutional holdings, and insider transactions in the same feed. It takes point-in-time seriously: each standardized statement carries its filing date and a version type (the documentation sample is a restated version), so revised figures are labeled as such. The pricing reflects that. The Individual plan is $150 a month for personal use only, with no redistribution or display, and the Startup plan that adds commercial use and display rights starts at $333 a month, steps to $666 after six months, and reaches $999 a month after a year, billed quarterly. Enterprise starts at $1,250 a month.
4. Alpha Vantage, best free key for prototypes
Alpha Vantage's free key is the quickest way to prototype: 25 requests a day across most datasets, including normalized income statements, balance sheets, and cash flows, and unlimited requests for verified open-source and educational projects. Premium plans price by rate, from $49.99 a month for 75 requests a minute to $249.99 for 1,200, with no daily cap. Two limits matter for an FMP replacement: statement rows carry fiscalDateEnding and reportedCurrency but no filing date or accession number (we checked the live demo response), and the terms grant a personal, non-commercial license unless you agree otherwise in writing. Its strength is market data: it is a Nasdaq-licensed provider of real-time and 15-minute delayed US quotes on premium plans. We compared it in depth in Alpha Vantage alternatives.
5. Massive (formerly Polygon.io), best when price data comes first
Polygon.io became Massive on October 30, 2025, and existing APIs and keys carried over. It is a market data API first: the free Stocks Basic plan is 5 calls a minute with two years of end-of-day data, and the paid stock plans run from $29 to $199 a month with unlimited calls, flat files, and WebSockets. Fundamentals are an add-on: income statements, balance sheets, cash flows, and ratios through the $29 a month Financials & Ratios expansion or bundled into the $199 Stocks Advanced plan, updated end of day with records back to March 29, 2009, on individual-use licenses.
Its documentation is candid about provenance: filing_date is “the date of the most recent SEC filing that included this period's data. This is not necessarily the date this period was originally filed.” For point-in-time work you would join its EDGAR index endpoint yourself. Massive has also added SEC filings datasets (13F, Forms 3 and 4, 10-K sections, 8-K text) to its docs. If prices and trades are the core of your app and fundamentals are secondary, it is the right shape.
6. Finnhub, best for estimates and global data on an enterprise budget
Finnhub's free tier is more useful for fundamentals than its reputation suggests: 60 calls a minute on US data, including financials as reported, where each report carries its SEC accession number, form, and filing dates, plus key metrics and the SEC filings feed. Standardized statements, ownership, and dividends are not on it. Everything else sits in one All-In-One plan at $3,500 a month, billed annually: 30+ years of standardized statements (annual and quarterly), global coverage, ownership, executive compensation, 20+ years of EPS and revenue estimates with five years forward, and tick-level US market data.
There is no smaller fundamentals plan in between, and both listed plans carry a “Personal Use. Terms apply” license, so commercial terms go through sales. If you need 20+ years of consensus estimates alongside global fundamentals, it is built for exactly that; for fundamentals alone, it is the most expensive option here.
7. SEC EDGAR APIs, the free primary source
If you can build the normalization layer yourself, the primary source is free. SEC's data.sec.gov APIs need no API key, return JSON for every filer's submission history and the XBRL facts from 10-K, 10-Q, 8-K, 20-F, 40-F, and 6-K filings, and update in real time as filings are disseminated, with a nightly bulk ZIP. Every fact carries its accession number, form, and filing date, and SEC's website policy lets you copy and redistribute the information without permission.
The work is everything a vendor does for you: mapping each company's tags onto one schema (Apple reports revenue as RevenueFromContract), building the quarters no filing reports, and staying under SEC's fair-access limit of 10 requests per second with a declared User-Agent. The XBRL endpoints also include only standard-taxonomy facts that apply to the entire filing entity, so segment breakdowns and company-specific extension tags are out of reach without parsing the filings themselves. Our guide to turning XBRL into JSON covers that build.
Migrating from FMP: an endpoint map
If FMP is already wired into your code, most calls have a one-to-one StockFit endpoint. The table shows which plan each needs on both sides, from FMP's plan matrix and StockFit's tier list as of October 16, 2026, and it cuts both ways: FMP includes insider trades, Congress trades, and peers on cheaper plans than StockFit, while StockFit includes statements, as-reported data, 13F, and ETF holdings on cheaper plans than FMP.
| Dataset | FMP endpoint | FMP plan | StockFit endpoint | StockFit plan |
|---|---|---|---|---|
| Income, balance sheet, cash flow | /stable/income-statement | Basic (87 symbols), Starter (US) | /api/financials/income-statement | Free (1 year), Starter (5 years), Stock (20+ years) |
| As-reported statements | /stable/income-statement-as-reported | Starter (Basic: annual, 87 symbols) | /api/financials/as-reported | Free |
| Key metrics and ratios | /stable/key-metrics, /stable/ratios | Starter (annual only), Premium | /api/financials/key-metrics | Starter |
| Piotroski and Altman scores | /stable/financial-scores | Basic (87 symbols), Starter (US) | /api/financials/scores | Starter |
| Revenue segmentation | /stable/revenue-product-segmentation | Starter (annual only), Premium | /api/footnotes/revenue-segmentation | Starter |
| Insider trades (Form 4) | /stable/insider-trading/search | Starter | /api/insider-transactions | Stock |
| 13F manager holdings | /stable/institutional-ownership/extract | Ultimate | /api/ownership/portfolio | Stock |
| ETF holdings | /stable/etf/holdings | Ultimate | /api/fund/holdings | Starter (N-PORT), ETF (daily) |
| Executive compensation | /stable/governance-executive-compensation | Premium (87 symbols below it) | /api/executives/compensation | Stock |
| Peer companies | /stable/stock-peers | Basic | /api/company/peers | Stock |
| Senate and House trades | /stable/senate-trades, /stable/house-trades | Starter | /api/congress/senate/trades | Pro |
| SEC filings by company | /stable/sec-filings-search/symbol | Starter (Basic: 1 year) | /api/filings | Free |
| End-of-day prices | /stable/historical-price-eod/full | Basic (87 symbols), Starter (US) | /api/price/history | Free (2 years), Starter (5 years), Stock (full) |
| Earnings call transcripts | /stable/earning-call-transcript | Ultimate | No equivalent | Not offered |
| Forex, crypto, technical indicators | Several | Varies by dataset | No equivalent | Not offered |
The request itself changes in two places, the base URL and the auth header:
# FMP
curl "https://financialmodelingprep.com/stable/income-statement?symbol=AAPL&period=quarter&apikey=$FMP_API_KEY"

# StockFit
curl "https://api.stockfit.io/v1/api/financials/income-statement?symbol=AAPL&period=quarter&limit=4" \
  -H "Authorization: Bearer $STOCKFIT_API_KEY"
Plan for two shape changes. StockFit nests values under facts with sources and derived beside them, and a few field names differ: FMP's researchAndDevelopmentExpenses is researchAndDevelopment, and weightedAverageShsOutDil is weightedAverageSharesOutstandingDiluted. FMP returns fiscalYear as a string and the period in period; StockFit returns fiscalYear as a number and the period in fiscalPeriod.
Which FMP alternative should you choose?
- Audit-grade US fundamentals you can show in your product, on a small budget: StockFit, commercial from $19 a month.
- Global fundamentals for personal research: EODHD.
- SEC-sourced fundamentals with display rights and an enterprise budget: Intrinio.
- A free key to prototype with: Alpha Vantage, or StockFit's free tier if you need every US-listed company.
- Prices, trades, and quotes first, fundamentals second: Massive.
- Consensus estimates with global fundamentals in one plan: Finnhub.
- No vendor at all, and time to build the pipeline: the SEC EDGAR APIs.
And stay on FMP if your app depends on earnings call transcripts, forex, crypto, or technical indicators alongside fundamentals: FMP covers them, and StockFit does not offer those datasets at all. If an audit trail is the reason you are looking, and run the Apple call above against your own account.
FAQ
Q.What is the best alternative to Financial Modeling Prep?
Q.Is there a free alternative to Financial Modeling Prep?
Q.Can I use Financial Modeling Prep data in a commercial app?
Q.How much does Financial Modeling Prep cost in 2026?
Q.Does Financial Modeling Prep include SEC accession numbers?
cik, filingDate, and acceptedDate on each row but no accession number, and the as-reported example carries no filing reference at all. StockFit maps every value to the accession number, form type, and filing date of the filing that supplied it.Q.Which financial data APIs include SEC accession numbers?
Q.Which Financial Modeling Prep plan includes 13F and ETF holdings?
Q.How do I migrate from FMP to StockFit?
https://api.stockfit.io/v1/api, send your key in an Authorization: Bearer header, and map each endpoint with the table in this post (for example, /stable/income-statement becomes /api/financials/income-statement). Expect two shape changes: values are nested under facts with a sources map beside them, and a few field names differ, such as researchAndDevelopmentExpenses becoming researchAndDevelopment.Ready to build?
Free API key, no credit card.