Insider Cluster Buys: What You Need to Know for Success
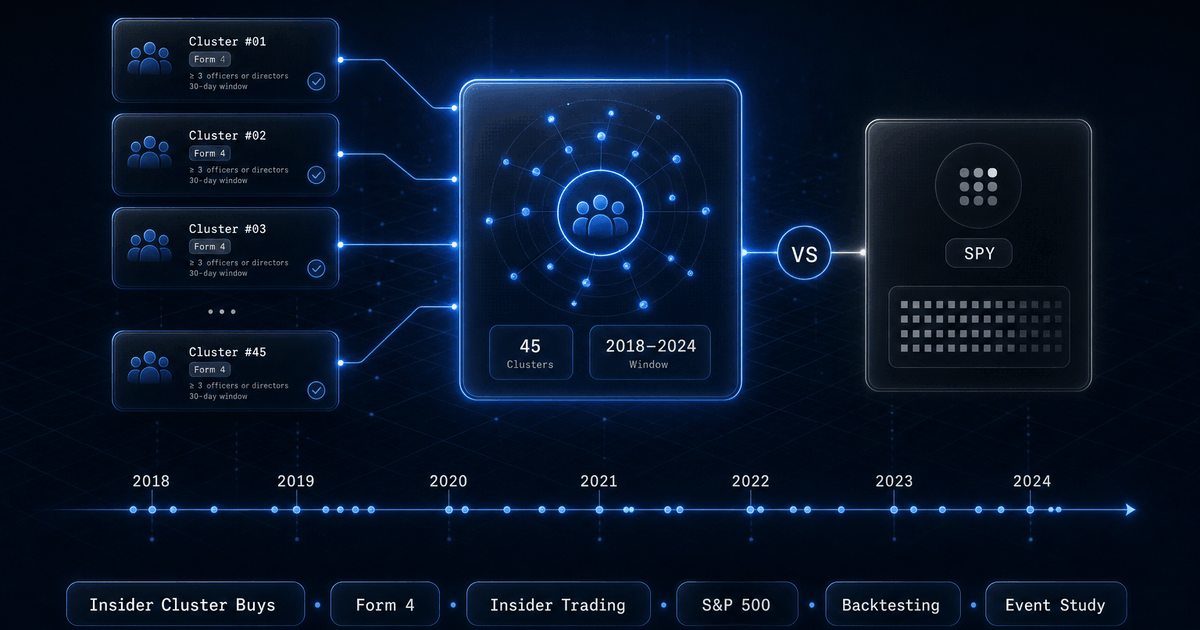
Does the insider cluster buy signal beat the market? We tested 45 discretionary S&P 500 clusters from 2018 to 2024 against SPY using Form 4 data.
The folk wisdom: when three or more officers or directors at the same company buy stock on the open market in a short window, smart money is voting with its own wallet and the stock outperforms. The academic literature, mostly built on small-cap data, supports the claim. We wanted to know whether the insider cluster buy signal actually works inside the S&P 500, where executives are paid in stock and rarely write checks for shares the way directors of a $300M micro-cap do.
So we did the work. Every Form 4 filing from 503 S&P 500 tickers between January 1, 2018 and December 31, 2024 was pulled through the StockFit /api/insider-transactions endpoint. We filtered to open-market purchases (transaction code P), kept only officer and director buys, dropped owners who looked programmatic (more than three buys in the window, which captures DSPP plans and director-comp-via-shares programs), and ran rolling 30-day windows looking for at least three distinct insiders buying together. Forty-five discretionary clusters survived. We benchmarked every one against SPY using yfinance daily adjusted close. Here is what we found.
The equal-weighted basket of cluster-buy stocks beats SPY at every horizon and peaks near +9.5% excess return around day 270. By day 365 the edge gives most of itself back to +3.1%. The mean is positive but the median is slightly negative, which tells you the distribution is right-skewed: a handful of huge winners (Carvana, First Solar, GE) carry the average while the typical cluster does about the same as buying the index.
That headline is more interesting than it looks. Most casual write-ups of insider buying signals quote a juicy outperformance number, but they rarely show you the median, the hit rate, or the regime where the signal works. The rest of this post breaks down what actually drives the +3.1% and where it concentrates.
What is an insider cluster buy signal?
Every officer, director, and 10%-owner of a US public company must report transactions in their own stock to the SEC on Form 4 within two business days. The form has a transaction-code field where P means open-market purchase, S means open-market sale, M means option exercise, A means grant or award, and a dozen other codes cover gifts, conversions, and inheritances. Only P represents an insider voluntarily putting their own money in. The other codes are mostly compensation accounting. The officer and director identities on these same filings also power our Executive Officers API.
An insider cluster buy is the event where multiple distinct insiders independently file P-coded purchases for the same company within a short window. The academic argument is simple: any single insider has information you do not, but they also have personal liquidity needs, divorce settlements, and tax events that drive their trades. When three or four insiders coincidentally show up on the buy side in a 30-day window, the most likely explanation is that they share a view about the stock. That view is the signal.
For more on where Form 4 sits in the broader SEC filing taxonomy and what each transaction code means, see the SEC forms field guide. For background on look-ahead bias and why event-study methodology matters here, see point-in-time fundamentals for backtesting. The transaction-code field is one of eight SEC EDGAR alternative data signals we walk through for small quant pods.
How we built the discretionary cluster dataset
Two methodology choices changed the answer more than anything else we did. The first was sticking strictly to transaction code P. The second was filtering out programmatic buyers. Both deserve their own paragraphs because both reverse common-sense intuitions.
1. Only P-coded buys count
If you call /api/insider-transactions with filter=buys, you get every transaction the SEC classifies as an acquisition: open-market purchases, option exercises, grants, gifts, and a few obscure derivative conversions. Most of that volume is not discretionary. An option exercise is a calendar event scheduled years earlier. A grant is compensation. A gift is not buying. Mixing them dilutes the signal. We used filter=significant (which restricts to P and S only) and then client-side filtered to transactionCode === 'P' and acquiredDisposed === 'A'. That left 5,696 real open-market purchases across the universe.
2. Filtering out programmatic buyers
Some S&P 500 names show extraordinary P-buy volume because they run plans that move officer and director compensation through the open market. Consolidated Edison (ED) is the cleanest example we saw: fourteen distinct officers, each filing twenty to fifty P-coded buys over the seven-year window, median size 23 shares (about $2,000). Every month qualifies as a "cluster" under the naive definition. The mechanism is a direct stock purchase plan that pays board fees and a slice of officer comp in shares bought on the market. Those buys are not discretionary conviction; they are payroll.
Simon Property Group (SPG) showed a similar but less extreme pattern. Fifteen directors, sixteen buys each over seven years, median size $29,000: looks like quarterly board-comp paid in shares rather than discretionary purchases. Texas Pacific Land (TPL) had a single trustee (Murray Stahl) filing 2,720 P-coded buys of one to three shares at a time, almost every trading day. None of these are signals; they are accounting.
The cleanest filter we found: drop any owner whose total P-buy count over the seven-year window exceeds three. This excludes every DSPP-style accumulator (typically dozens of buys per owner) and the Stahl-type single-zealot pattern, while keeping the legitimate "a director who bought a meaningful slug once a year for three years" case. After this filter, 1,048 buys (out of 5,696 raw) remained as discretionary. From those, 45 clusters emerged across 40 tickers.
3. The cluster-detection rule
For each ticker, we sorted the surviving discretionary buys by date and walked a rolling 30-calendar-day window. When at least three distinct owner CIKs appeared inside any window, we recorded a cluster anchored to the last buy in the window (the moment the third or later insider confirmed the pattern). After a cluster fired, we advanced past it before scanning for the next one, so clusters never overlap. The same algorithm could be reproduced with the /api/insider-transactions/summary aggregate field uniqueBuyers for a faster monthly proxy, although the 30-day rolling rule catches events that straddle calendar months.
4. Forward returns and benchmark
For each cluster trigger date, we fetched daily adjusted-close prices for the ticker and for SPY (as the S&P 500 total-return benchmark) from yfinance, then computed forward returns at +30, +90, +180, and +365 calendar days. The trigger date is when the third insider confirmed, so the post-event window starts on the next trading day. Excess return is the ticker return minus SPY return at the matched horizon. Sector classification comes from /api/company/details via the issuer's SIC mapping.
Cluster-buy basket vs SPY: 9 months of alpha, then mean reversion
The hero chart above shows the equal-weighted basket of all 45 clusters in event time. Both lines start at zero on the trigger date. The cluster basket pulls ahead by day 60, opens a real gap by day 180, peaks at +20.3% vs SPY's +10.8% around day 270, and then SPY closes most of the gap by day 365.
Three readings of this curve are useful. First, the alpha is real but front-loaded: most of the excess accrues in the first nine months. Second, the mean reverts: hold past month nine and you are no longer being paid for the original signal, just for sector beta. Third, the peak being inside one year matches the academic finding that insider-trading-based momentum strategies should rotate positions on a one-to-two quarter horizon, not buy and hold.
The insider buying edge fades with horizon
Hit rate (the percentage of clusters that finish above SPY) is +58% at 30 days, +42% at 365 days. The 30-day number is the only horizon where insider buying meaningfully tilts the coin: roughly six out of ten clusters beat SPY in the first month. At one year the hit rate is below 50%, which means more than half the time you would have been better off in the index. The chart pairs hit rate with mean excess return on a secondary axis: notice that even though hit rate falls, mean excess stays positive at every horizon. That is the right-skew of the distribution again. A few large winners pay for many small losers.
The strongest signal: officers AND directors buy together
This was the most surprising slice we found. We bucketed each cluster by who participated: mixed (officers and directors both present), officers-only, or directors-only. The conventional wisdom is that some roles carry more signal than others. CEO buying is supposed to be the gold standard. The data says the conventional wisdom is wrong, or at least incomplete.
Mixed clusters (n = 30, mean +7.8%) materially outperform. Officer-only clusters (n = 7, mean -2.4%) and director-only clusters (n = 8, mean -9.8%) both lose to SPY on average. The implication is that what carries the signal is not the role per se but the cross-cohort confirmation: when both the inside-operations cohort (officers, day-to-day P&L exposure) AND the supervisory cohort (directors, fiduciary obligations) independently decide the stock is cheap on the same week, something has happened.
Looking at the named examples bears this out. The 2022 Carvana cluster that returned +345% over 365 days had three directors and two officers buying together. GE's May 2022 cluster (+64%) had Larry Culp (CEO) buying alongside a director and a CFO. NRG Energy's December 2022 cluster (+40%) had one CEO, five directors, and one officer. The losers, by contrast, were often officers-only (ALB May 2023, AES November 2023) where the operating team thought they saw value but the board did not weigh in.
Sector dispersion: Retail Trade dominates, Finance lags
Sector breakdown is messy because the per-sector sample sizes are small after filtering. The visible outlier is Retail Trade (n = 3, mean +120%), and that single number is almost entirely Carvana. The other categories cluster between zero and slightly negative. The bigger takeaway is that the popular intuition (insider clusters in banks and energy are particularly bullish) is not supported in the cleaned data: Finance, Insurance, and Real Estate as a combined bucket is the worst-performing sector with a mean of -7.6% over 365 days.
The most likely explanation is that banks and REITs trigger clusters precisely when there is a balance-sheet scare, and the scare is often justified. Insider directors of regional banks bought into the 2023 deposit panic, and a meaningful share of those clusters still finished underwater 365 days later. The cluster filed; the thesis was right (banks survived); but the equity multiple stayed compressed.
Year cohorts: 2022 was a goldmine, 2024 was a trap
Clusters fired in 2022 averaged +43.3% excess over 365 days with a +55% hit rate. Clusters fired in 2024 averaged -19.4%. This is the regime risk inherent in any momentum-style strategy: the same signal works dramatically differently depending on the macro setup.
Why 2022? Several mid-year sell-offs (the inflation re-rating, the 2022 bear market trough in October) created textbook conditions for high-conviction insider buying: prices were down, balance sheets were not impaired, and the insiders who knew their numbers were not impaired moved on the dislocation. Carvana, GE, First Solar, NRG, and Vistra all had their key clusters in late 2022 and rode the 2023 rally.
Why 2024? Three of the largest 2024 clusters were industry-specific stress events that have not resolved. ALB (lithium), DOW (chemicals), and CNC (managed care) all dropped further after the cluster filed. The same Form 4 pattern that worked in October 2022 underperformed in December 2024 because the underlying selloffs were different in character.
The standout clusters, named
The basket-level numbers obscure the actual events that drive them. The top five winners and bottom five losers below are reproducible from the same dataset (every insider's name is public via Form 4). Each card shows the cluster trigger date, sector, distinct-insider count, total dollar value committed, and the 365-day excess return vs SPY.
The biggest winners
The biggest losers
The 2022 Carvana cluster (CVNA) is the single most influential data point in this study. Three directors and two officers bought a combined $2.7 million worth of shares over a 30-day window when the stock was below $10. Twelve months later the stock was up nearly four-fold while SPY was up about 21%. That single cluster contributes most of the Retail Trade sector premium and a meaningful slice of the basket's mean excess return. Removing it drops the headline mean from +3.1% to about +0.4%.
How to replicate this analysis end-to-end
The pipeline is three calls per ticker plus one yfinance lookup. Token in the Authorization header, never as a URL parameter.
// 1. Pull all qualifying P-buys for a ticker over the analysis window.
const resp = await fetch(
  `https://api.stockfit.io/v1/api/insider-transactions`
    + `?symbol=${symbol}&filter=significant`
    + `&startDate=2018-01-01&endDate=2024-12-31`
    + `&pageSize=100&page=${page}`,
  { headers: { Authorization: `Bearer ${token}` } }
);
const { data, totalPages } = await resp.json();

// 2. Filter client-side to discretionary buys only.
const buys = data.filter(t =>
  t.transactionCode === 'P' &&            // open-market purchase
  t.acquiredDisposed === 'A' &&           // acquired side
  !t.isDerivative &&                      // ignore derivative legs
  (t.isOfficer || t.isDirector) &&        // officers and directors only
  !t.isTenPercentOwner                    // exclude beneficial-owner-only filings
);

// 3. Drop programmatic accumulators (>3 buys per owner over 7y).
const perOwner = new Map();
for (const b of buys) perOwner.set(b.ownerCik, (perOwner.get(b.ownerCik) || 0) + 1);
const discretionary = buys.filter(b => (perOwner.get(b.ownerCik) || 0) <= 3);

// 4. Rolling 30-day cluster detection.
const sorted = discretionary.sort((a,b) => a.transactionDate.localeCompare(b.transactionDate));
const clusters = []; let i = 0;
while (i < sorted.length) {
  const start = sorted[i].transactionDate;
  const end = addDays(start, 30);
  let j = i; while (j < sorted.length && sorted[j].transactionDate <= end) j++;
  const window = sorted.slice(i, j);
  const distinct = new Set(window.map(t => t.ownerCik));
  if (distinct.size >= 3) {
    clusters.push({
      triggerDate: window[window.length - 1].transactionDate,
      distinctOwners: distinct.size,
      totalValue: window.reduce((s,t) => s + t.transactionValue, 0),
    });
    i = j;          // non-overlapping
  } else i++;
}
Forward returns come from yfinance via the yahoo-finance2 npm package (or yfinance in Python, same data). For each cluster trigger date, fetch ticker and SPY daily adjusted close, look up the close on the first trading day on or after each target horizon, and subtract. Adjusted close handles splits and dividends, so this is total return.
import YahooFinance from 'yahoo-finance2';
const yf = new YahooFinance();

// 5. Fetch daily adjusted close. Buffer 7 days before, 400 days after.
async function dailyClose(symbol: string, start: string, end: string) {
  const rows = await yf.historical(symbol, { period1: start, period2: end, interval: '1d' });
  const map: Record<string, number> = {};
  for (const r of rows) {
    const d = new Date(r.date).toISOString().slice(0, 10);
    map[d] = (r.adjClose ?? r.close) as number;
  }
  return map;
}

// 6. First trading day on or after target, up to 7 calendar-day lookahead.
function priceOnOrAfter(prices: Record<string, number>, target: string): number | null {
  for (let i = 0, d = target; i <= 7; i++, d = addDays(d, 1)) {
    if (prices[d] != null) return prices[d];
  }
  return null;
}

function forwardReturn(prices: Record<string, number>, anchor: string, days: number): number | null {
  const p0 = priceOnOrAfter(prices, anchor);
  const pN = priceOnOrAfter(prices, addDays(anchor, days));
  return p0 && pN ? pN / p0 - 1 : null;
}

// 7. Excess vs SPY at each horizon.
const spy = await dailyClose('SPY', '2017-12-01', '2026-02-01');
for (const cluster of clusters) {
  const prices = await dailyClose(cluster.ticker, '2017-12-01', '2026-02-01');
  for (const h of [30, 90, 180, 365]) {
    const t = forwardReturn(prices, cluster.triggerDate, h);
    const s = forwardReturn(spy, cluster.triggerDate, h);
    cluster['excess_' + h] = t != null && s != null ? t - s : null;
  }
}

// Small helper used above.
function addDays(yyyymmdd: string, days: number): string {
  const d = new Date(yyyymmdd + 'T00:00:00Z');
  d.setUTCDate(d.getUTCDate() + days);
  return d.toISOString().slice(0, 10);
}
That is the full pipeline. Pagination over the universe, discretionary filter, rolling 30-day cluster detection, yfinance lookups for the ticker and SPY at each horizon, subtract. Cache the intermediate JSON to disk so you can iterate on the cluster rule without re-burning your API quota.
For non-cluster insider work, the /api/insider-transactions/summary endpoint returns 3, 6, and 12-month aggregates including uniqueBuyers and netShares per ticker without pagination, and /api/insider-transactions/roster gives you the full insider roster with last transaction date and shares held. /api/insider-transactions/by-insider lets you pull every transaction a specific insider has filed across every company they are listed at, which is useful for identifying serial buyers vs one-time conviction trades.
FAQ
What counts as an insider cluster buy?
For this study, an insider cluster buy is at least three distinct officer or director owner CIKs filing Form 4 transactions with transaction code P (open-market purchase) and acquired/disposed flag A on the same ticker, all within a 30 calendar-day rolling window. 10%-owner-only filings and derivative-leg transactions are excluded. The cluster's trigger date is the last buy in the window (when the third or later insider confirms the pattern).
Why filter to discretionary buyers only?
Some S&P 500 names run direct stock purchase plans or pay board fees in shares bought on the open market. Those buys are filed as Form 4 transaction code P but they are not discretionary; they are scheduled compensation accounting. Including them generates a "cluster" almost every month and overwhelms the signal. Owners with more than three P-buys in the seven-year window were treated as programmatic and excluded.
Why use SPY as the benchmark instead of sector ETFs?
Sector ETFs would tighten the comparison but reduce statistical power further with only 45 events. SPY is the most defensible single benchmark for an S&P 500 universe and matches the simplest investable alternative (own the index). A sector-relative version of this analysis is on the roadmap; expect the sector-relative basket to show slightly more alpha than the SPY-relative version because the cluster signal concentrates in sectors that underperformed the broad market.
Does the insider buying signal work outside the S&P 500?
Academic literature suggests yes, and often more strongly. Small-cap and mid-cap stocks have insiders who are more likely to put their own capital in (versus receiving equity compensation that dwarfs their salary), and the information asymmetry between insiders and the market is larger when sell-side coverage is thin. The S&P 500 is the hardest universe for this signal to work in, which makes a +3.1% mean excess at 365 days more interesting than it looks at first glance.
How is forward return computed?
For each cluster trigger date, the entry price is the adjusted close on the first trading day on or after the trigger. The exit prices are the adjusted close on the first trading day on or after trigger + 30, + 90, + 180, and + 365 calendar days. Return is exit divided by entry, minus one. Adjusted close includes splits and dividends, so this is a total-return measurement. Excess vs SPY uses the same calculation on the SPY series and subtracts.
What is the difference between transaction codes P, M, and A on Form 4?
P is open-market or private purchase: the insider is buying with their own cash. M is exercise of a derivative security, normally a previously-granted stock option. A is grant, award, or other acquisition from the company, typically compensation. Only P represents discretionary buying with personal capital. The full code list and the underlying Form 4 reporting requirements are documented in the SEC's Form 4 instructions.
Can I reproduce these numbers with the StockFit free tier?
The /api/insider-transactions family is gated to the Stock plan ($39/mo) and Pro plan ($69/mo), so a full S&P 500 backtest is not free-tier reachable. The free tier covers /api/symbols for the universe and /api/company/details for sector classification.
Methodology footnote: S&P 500 constituents (snapshot today, survivorship bias acknowledged). Window: 2018-01-01 to 2024-12-31. Cluster definition: At least 3 distinct officer or director insiders buying within any rolling 30 calendar-day window. Filter: Owners with more than 3 P-buys in the analysis window are treated as programmatic (DSPP / scheduled comp) and excluded. Benchmark: SPY adjusted close, same horizons. The S&P 500 constituent list is a snapshot of today's index, which introduces survivorship bias (companies that fell out of the index during 2018 to 2024 are not in the dataset). Mean reverters and acquired companies are not present. The chart numbers are aggregates over 45 events; individual cluster results vary widely as the named-cases section shows.
Ready to build?
Free API key, no credit card. Every endpoint mentioned in this post is available on the free tier.
Get Your Free API Key